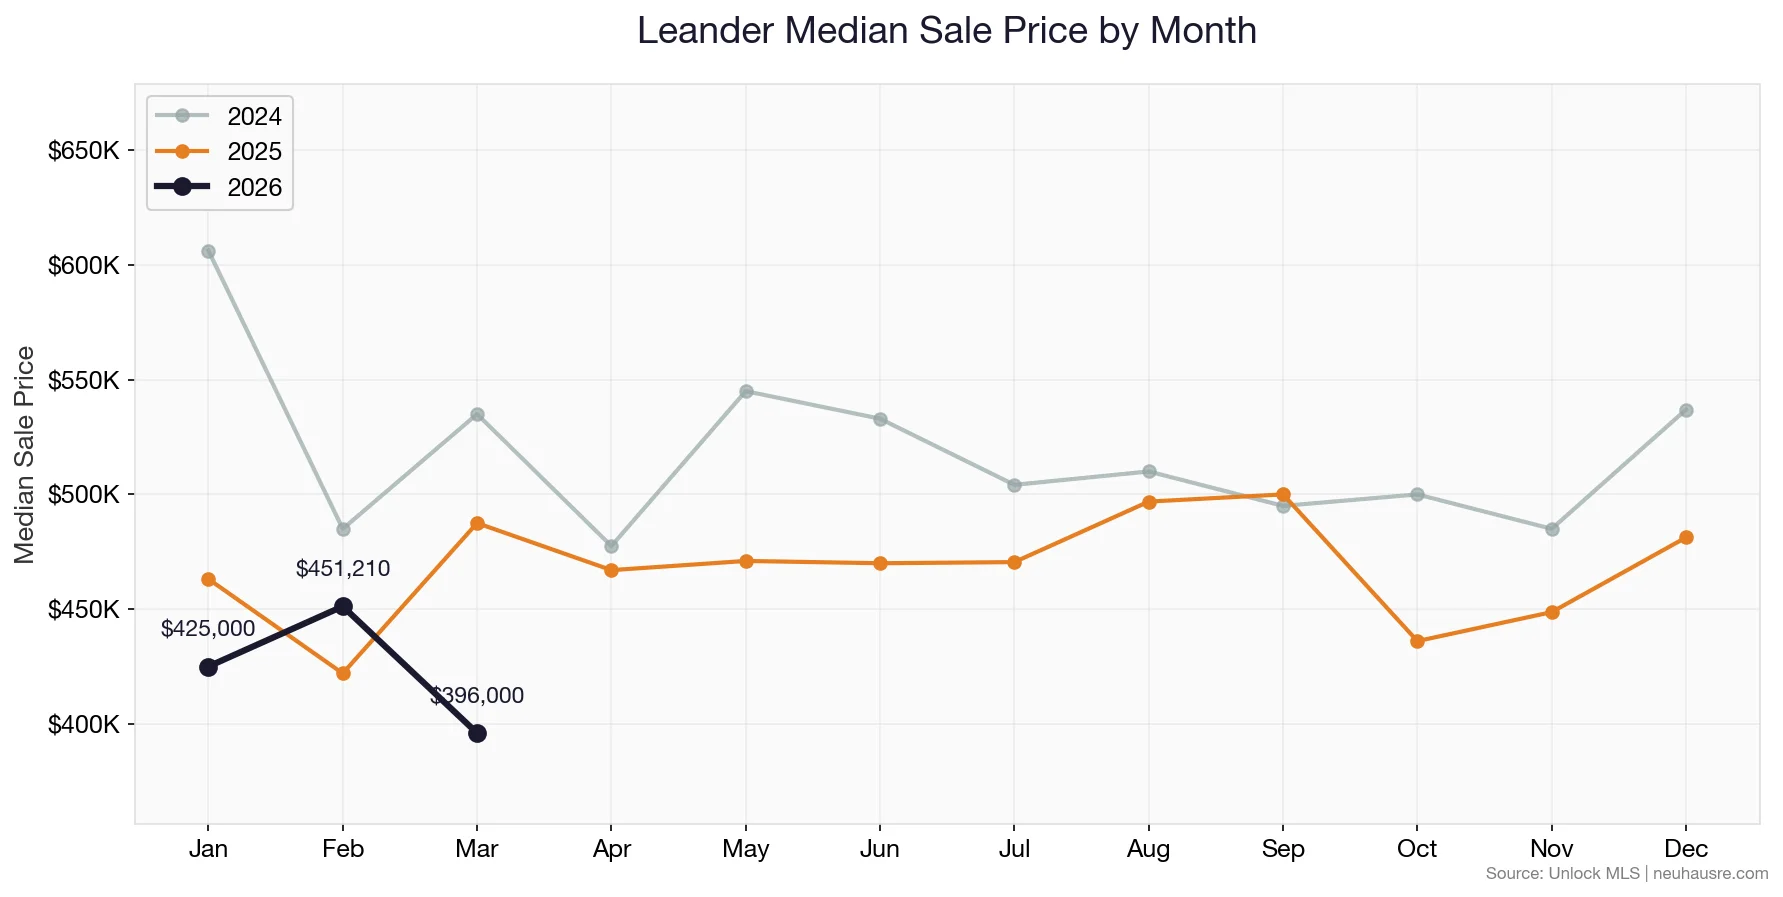
Leander’s median sale price came in at $451,210 in February 2026 — up 6.9% from February 2025’s $422,000.
Before diving into what it means, lets look at the full picture.
February 2026 by the Numbers
90 homes closed in Leander last month. Here’s the snapshot:
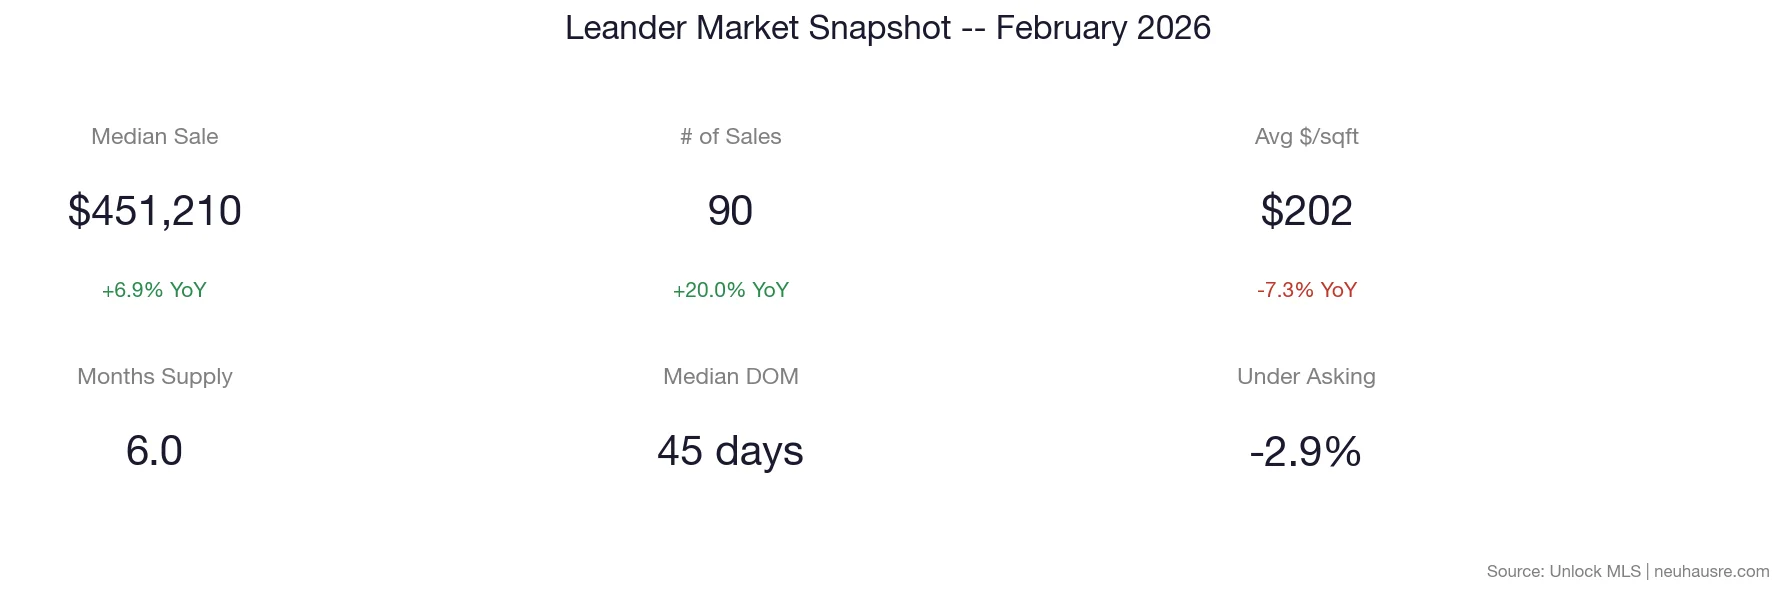
The numbers at a glance:
- Median Sale Price: $451,210 (+6.9% year-over-year)
- Average Sale Price: $515,166 (-5.4% YoY)
- Price Per Square Foot: $202 (-7.3% YoY)
- Total Sales Volume: $46.4 million
- Homes Sold: 90 (+20.0% YoY)
- Average Home Size: 2,562 square feet
Understanding Leander’s February Market Dynamics
Leander closed 90 homes in February at a $451,210 median — down from $422,000 in February 2025 on volume. The market here is heavily influenced by master-planned communities (Crystal Falls, Travisso, Larkspur) and the Red Line commuter rail, which makes it popular with Austin commuters who want space without the city price tag.
The Inventory Picture: A Market in Balance
Leander currently has 540 active listings and 6.0 months of supply at the February sales pace. Six months of supply is the generally accepted benchmark for a balanced market. Below that is a seller’s market; above it favors buyers.
That puts Leander firmly in balanced market territory.
Where the Action Is (and Isn’t)
Not every price range moves the same way. The chart below breaks it down:
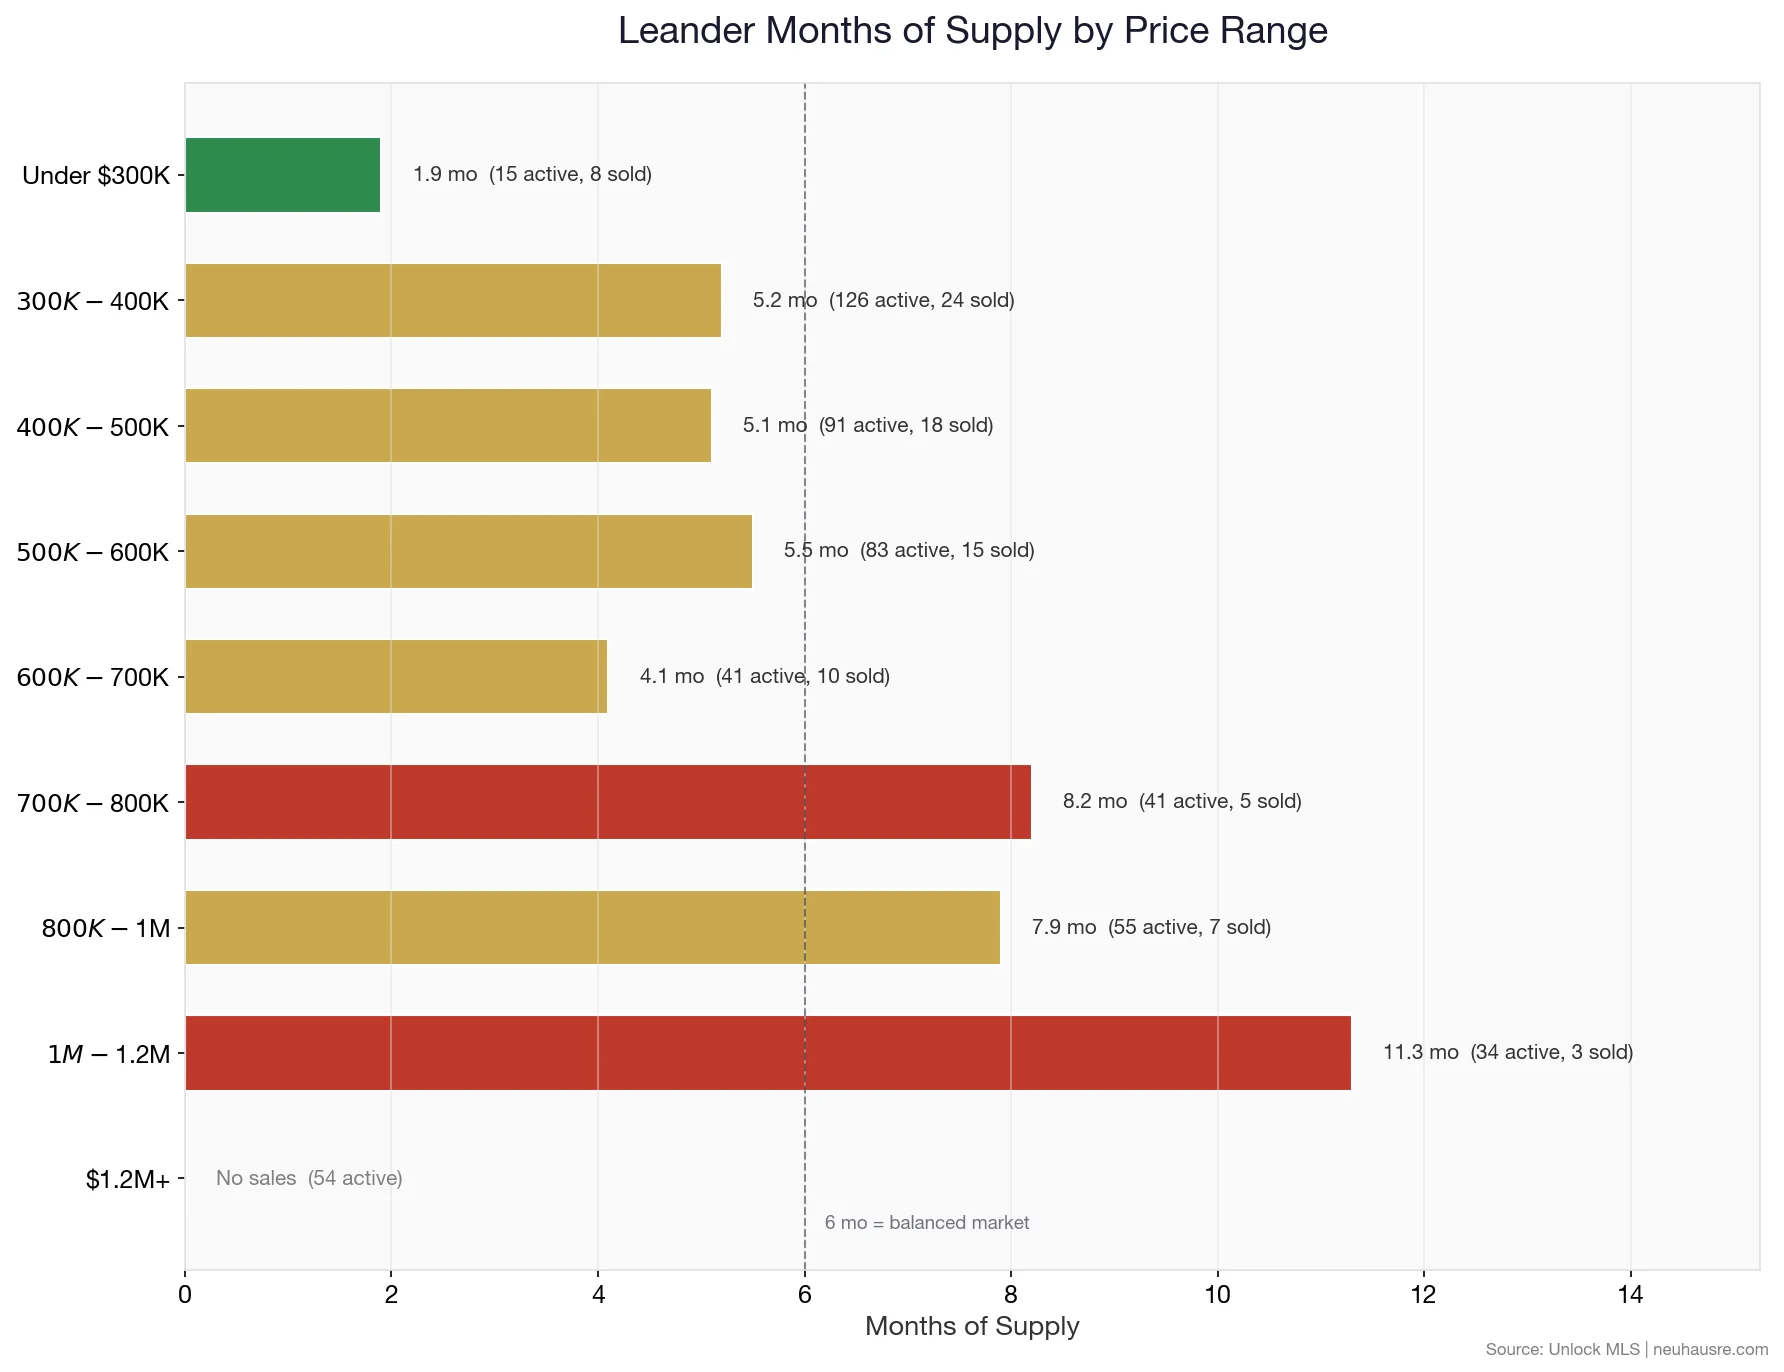
The Under $300K range is where buyers are competing, with under 4 months of supply. If you’re selling in that range, you have the upper hand.
The $700K-$800K range has 8.2 months of supply (41 active listings, 5 sold in February). Buyers shopping there have real time and leverage.
How Fast Homes Are Selling
With 45 median days on market in February, Leander homes are moving faster than many neighboring cities. The active listing median DOM of 37 days confirms that the market has real momentum. Leander is one of the few suburbs where buyer demand is keeping pace with inventory.
The median days on market for closed sales in February was 45 days. Active listings have a median DOM of 37 days, which gives you a sense of how the current inventory is performing.
Buyer Negotiating Power
Homes in Leander closed at -2.9% below asking price in February — modest but real negotiating room. The list-to-close ratio of 92.8% tells you that sellers who price correctly are getting deals done without dramatic concessions.
The Bigger Picture: Leander Pricing Over Time
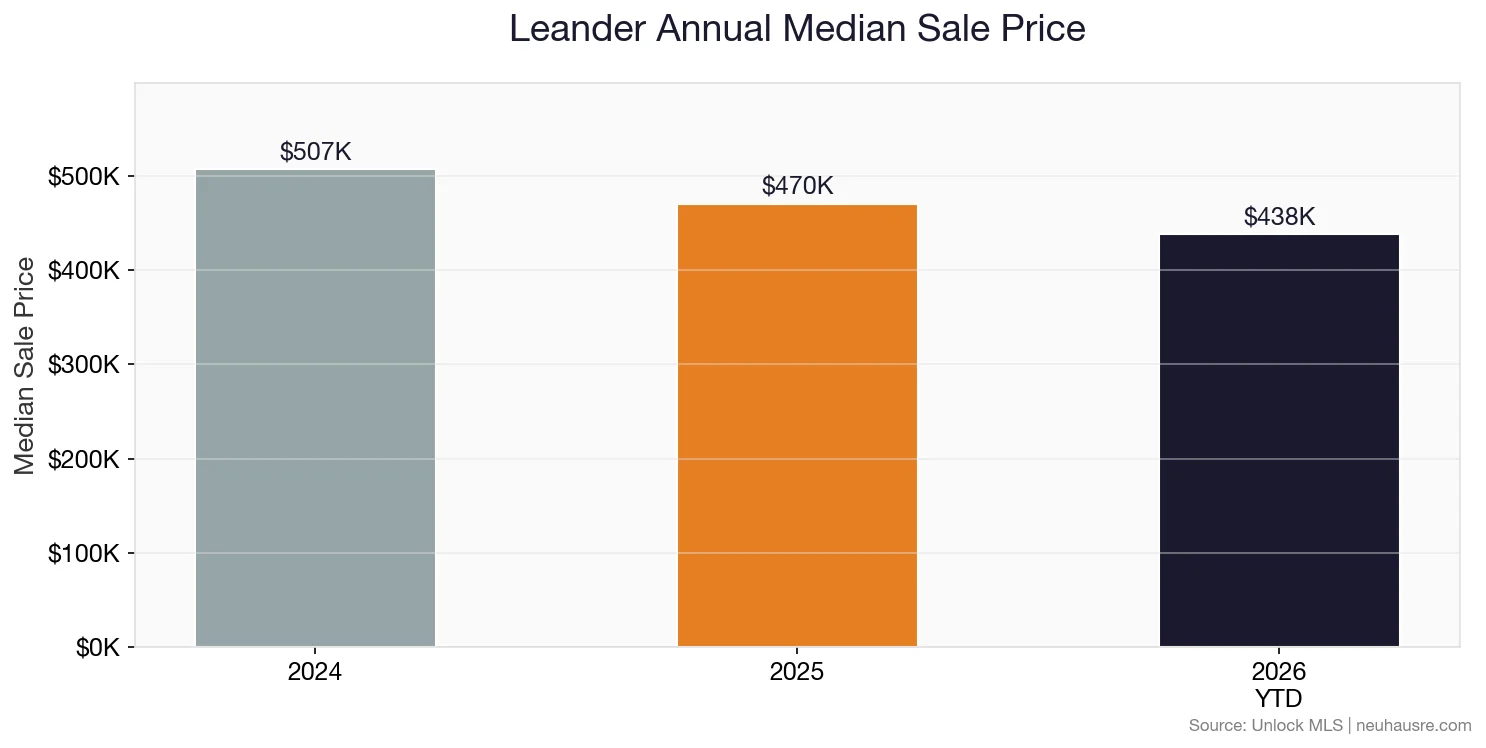
The 2024 full-year median was $507,085. The 2025 full-year median was $470,250. The 2026 YTD median (January + February combined) is $438,105.
Leander’s annual median has been stable in the $460K-$500K range for two years. Unlike some markets that saw sharp corrections, Leander has held value better — partly due to the rail access and partly because its growth trajectory still has room to run as the city develops its downtown core.
The monthly view puts the current trend in sharper focus:
Frequently Asked Questions
What This Means for Buyers
Leander is a strong buy in the $400K-$550K range where months of supply stays manageable. The Red Line commuter rail is a genuine differentiator — factor that into your total-cost-of-living calculation vs a cheaper home with a 45-minute drive. With homes closing 2.9% under asking, you have room to negotiate.
What This Means for Sellers
Leander sellers are in a reasonably good position relative to the broader market. The 45-day median DOM is healthy, and demand from rail commuters provides a consistent buyer pool. Price within 2-3% of comps and expect to close around asking — the days of 5%+ above list are gone, but the market isn’t broken.
All data sourced from Unlock MLS, current as of March 11, 2026. Leander market data includes residential single-family, townhome, and manufactured home sales.
Thinking about buying or selling in Leander? Contact the Neuhaus Realty Group for a personalized market analysis based on the latest data.
See all 15 city reports: Austin Area Market Updates: February 2026 Data


