
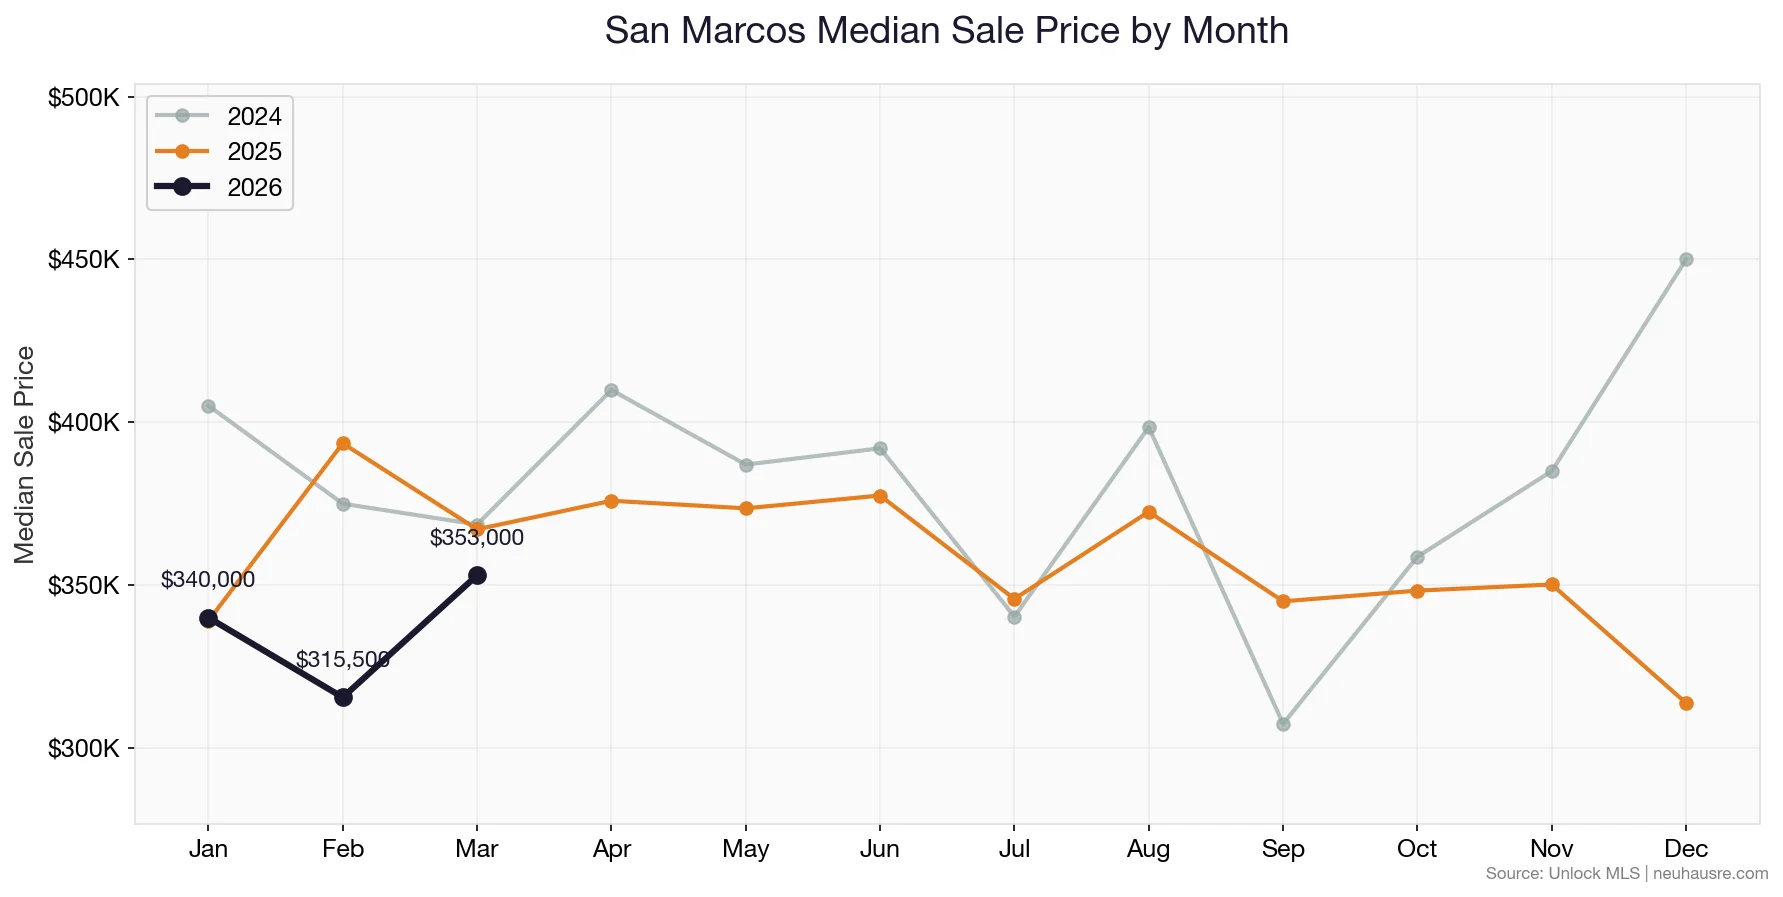
San Marcos’s median sale price came in at $315,500 in February 2026 — down 19.8% from February 2025’s $393,540.
Before diving into what it means, lets look at the full picture.
February 2026 by the Numbers
48 homes closed in San Marcos last month. Here’s the snapshot:
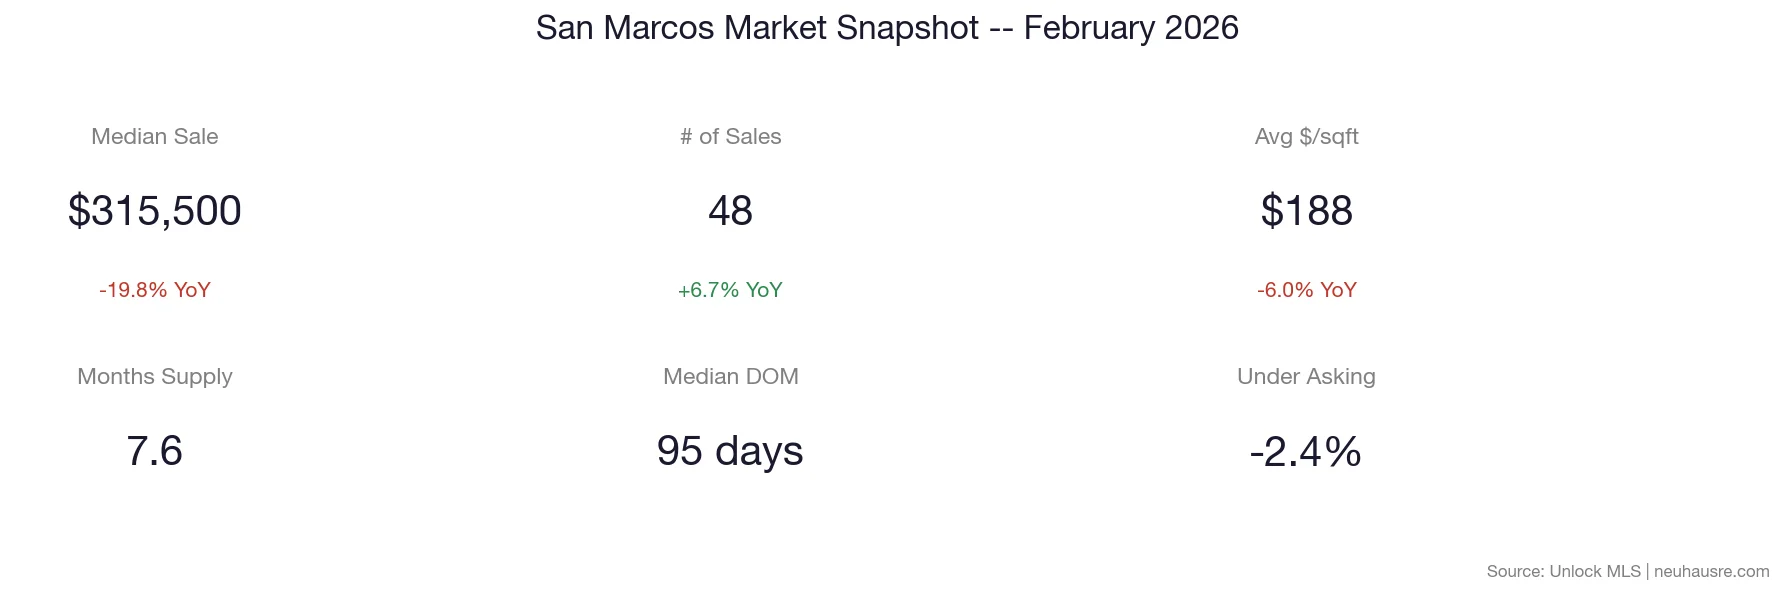
The numbers at a glance:
- Median Sale Price: $315,500 (-19.8% year-over-year)
- Average Sale Price: $372,116 (-5.6% YoY)
- Price Per Square Foot: $188 (-6.0% YoY)
- Total Sales Volume: $17.9 million
- Homes Sold: 48 (+6.7% YoY)
- Average Home Size: 1,964 square feet
Understanding San Marcos’ Unique Market Position
San Marcos closed 48 homes in February at a $315,500 median — making it the most affordable city in this analysis with consistent transaction volume. San Marcos is a dual-market city: the Texas State University student rental economy co-exists with permanent resident housing. Buyers need to be aware of which market they’re entering, as the dynamics differ significantly.
The Inventory Picture: Buyers Hold the Cards
San Marcos currently has 364 active listings and 7.6 months of supply at the February sales pace. Six months of supply is the generally accepted benchmark for a balanced market. Below that is a seller’s market; above it favors buyers.
That puts San Marcos firmly in buyer’s market territory.
Where the Action Is (and Isn’t)
Not every price range moves the same way. The chart below breaks it down:
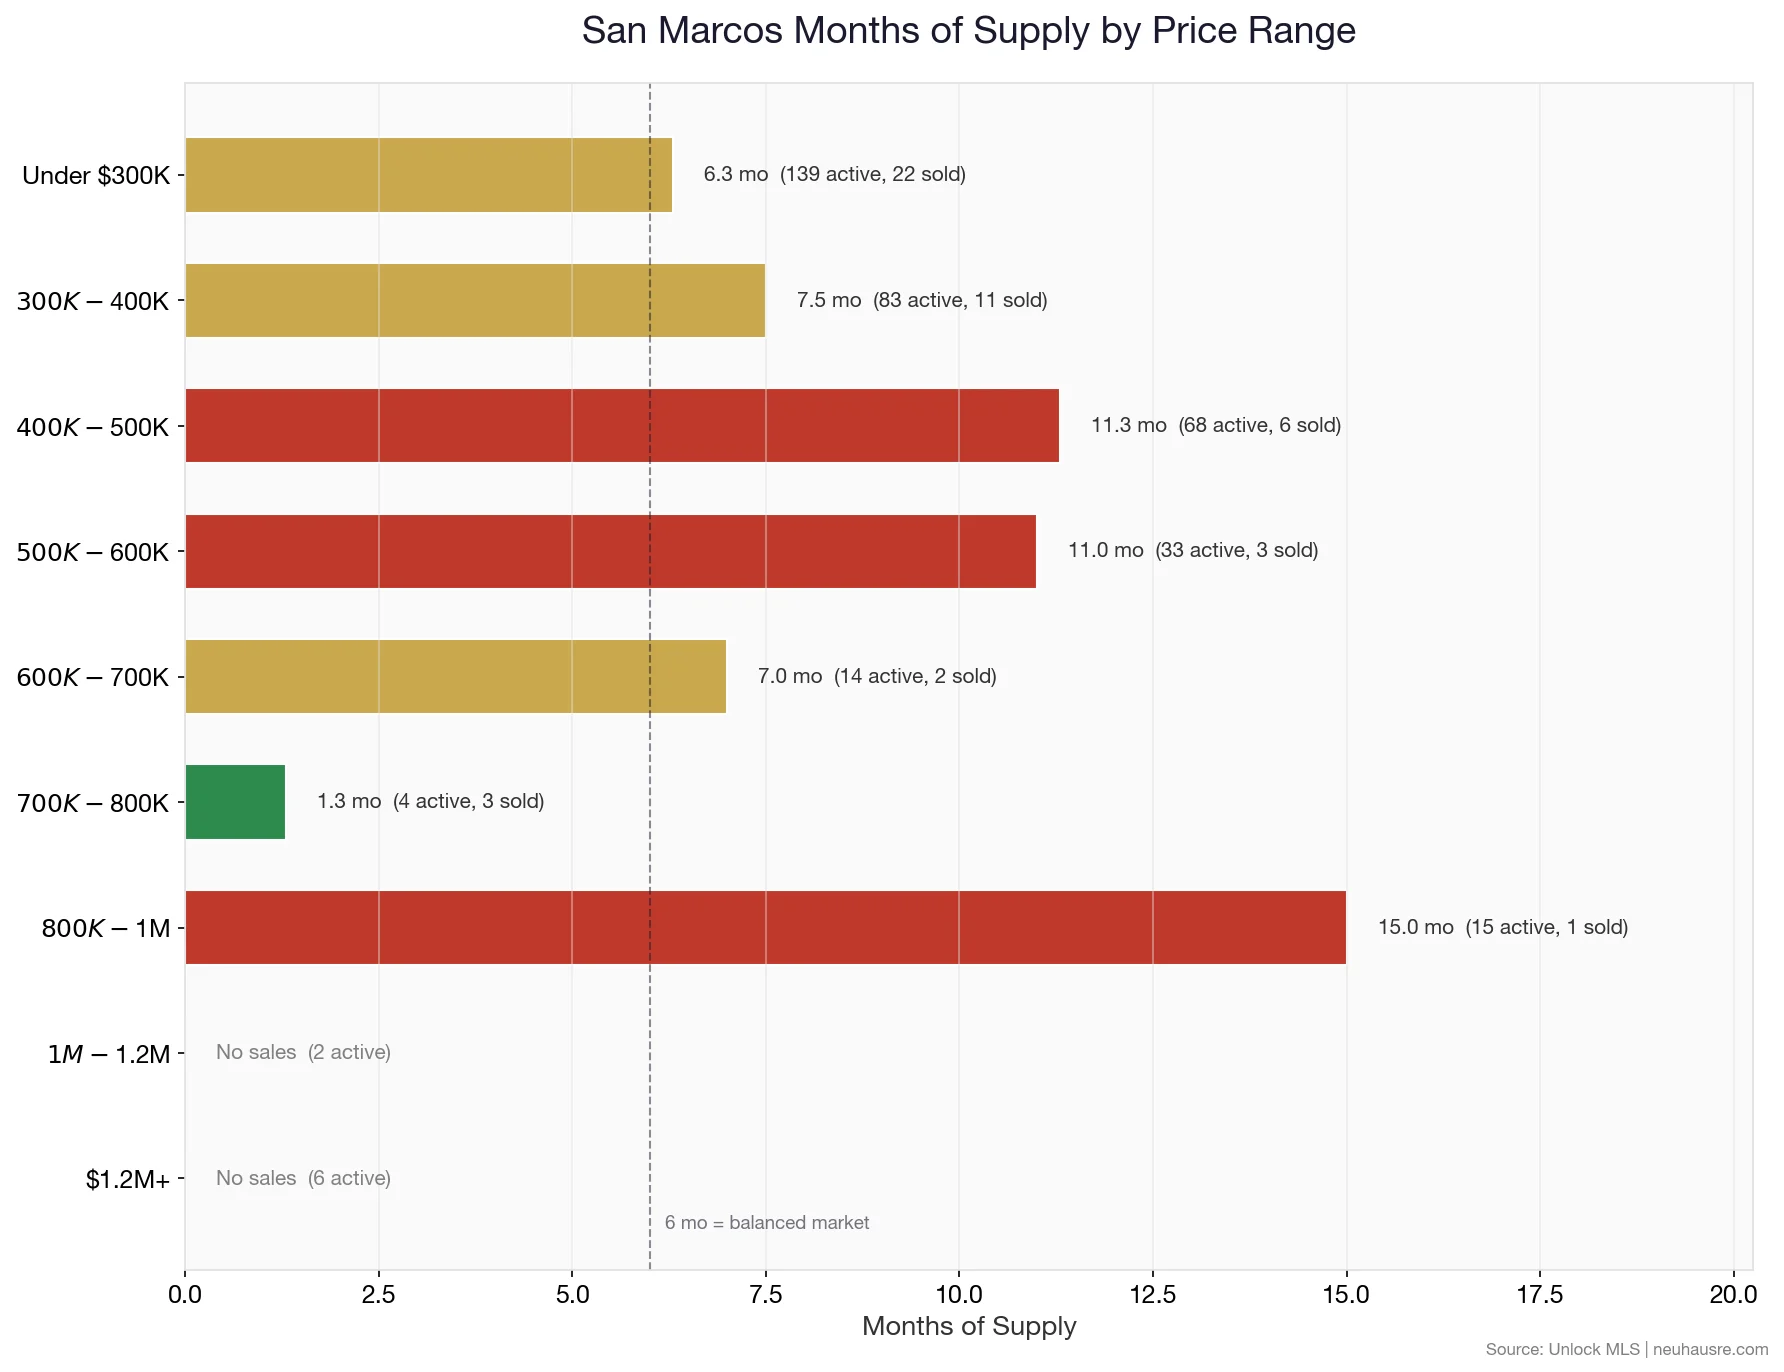
The $700K-$800K range is where buyers are competing, with under 4 months of supply. If you’re selling in that range, you have the upper hand.
The $400K-$500K range has 11.3 months of supply (68 active listings, 6 sold in February). Buyers shopping there have real time and leverage.
How Fast Homes Are Selling
At 95 median days on market, San Marcos has the second-longest sell time in this analysis. That’s partly the university cycle (demand peaks at semester start), partly the city’s unique buyer pool, and partly that some sellers are still anchored to 2021-2022 pricing.
The median days on market for closed sales in February was 95 days. Active listings have a median DOM of 45 days, which gives you a sense of how the current inventory is performing.
Buyer Negotiating Power
Homes in San Marcos closed at -2.4% below asking price in February — modest but real negotiating room. The list-to-close ratio of 89.6% tells you that sellers who price correctly are getting deals done without dramatic concessions.
The Bigger Picture: San Marcos Pricing Over Time
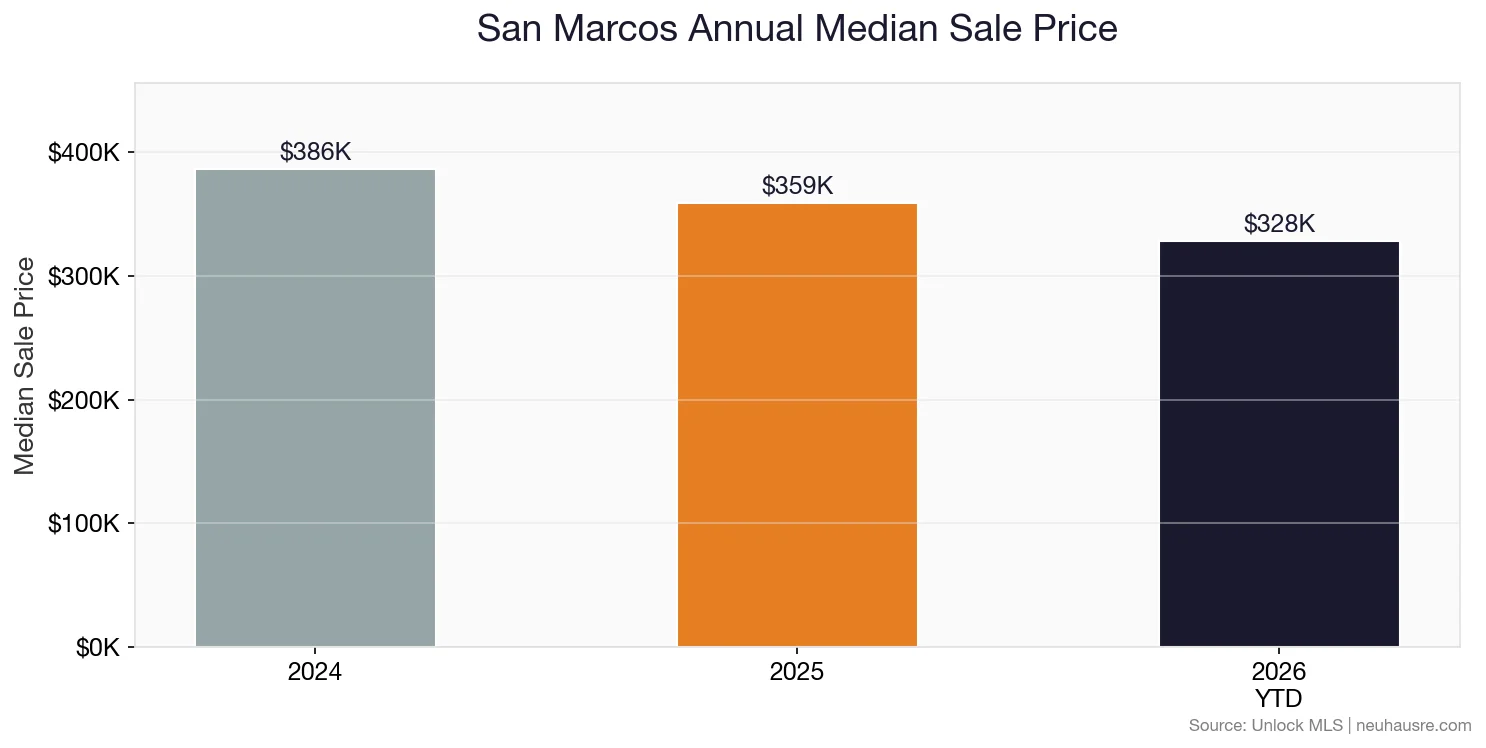
The 2024 full-year median was $386,000. The 2025 full-year median was $358,644. The 2026 YTD median (January + February combined) is $327,750.
San Marcos’ annual median has softened from the $400K-$430K range in 2024 to the $315K-$350K range in early 2026. That’s a significant drop that reflects both market correction and the ongoing graduation of pandemic-era buyers who may have been priced out by affordability. San Marcos is increasingly affordable — which will attract a new buyer wave.
The monthly view puts the current trend in sharper focus:
Frequently Asked Questions
What This Means for Buyers
San Marcos buyers are in a strong position. With 7+ months of supply and homes closing 2.4% under asking, you have leverage on both price and terms. The under-$300K segment is your best bet for relative competition and long-term resale strength. Avoid buying too close to the university if owner-occupied appreciation is your primary goal.
What This Means for Sellers
San Marcos sellers need patience and realistic pricing. Buyers have 364 listings to choose from, and they know it. If you’re priced right, you will sell — but expect negotiations and plan for closing cost credits to get deals across the finish line. The 95-day DOM average tells you: price it correctly from day one or face a long campaign.
All data sourced from Unlock MLS, current as of March 11, 2026. San Marcos market data includes residential single-family, townhome, and manufactured home sales.
Thinking about buying or selling in San Marcos? Contact the Neuhaus Realty Group for a personalized market analysis based on the latest data.
See all 15 city reports: Austin Area Market Updates: February 2026 Data


