
Wimberley’s February numbers just dropped, and the headline stat looks wild: the median sale price hit $725,000, up 54% from February 2025.
Before anyone panics (or celebrates), lets dig into what’s actually happening.
February 2026 by the Numbers
Fifteen homes closed in Wimberley last month. Here’s the snapshot:
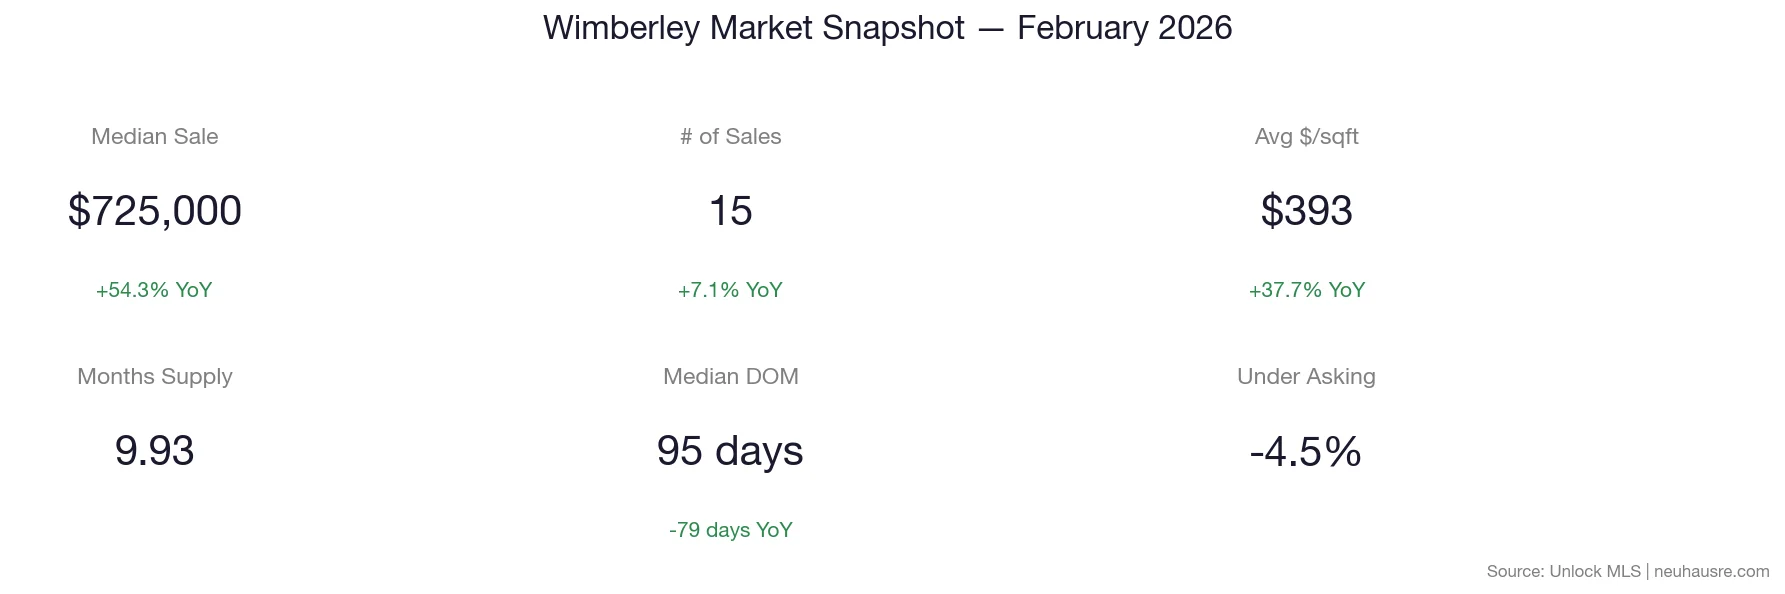
The numbers at a glance:
- Median Sale Price: $725,000 (up 54.3% year-over-year)
- Average Sale Price: $834,220 (up 4.8%)
- Price Per Square Foot: $393 (up 37.7%)
- Total Sales Volume: $12.5 million (up 12.3%)
- Average Home Size: 2,424 square feet
Why the 54% Jump Is Misleading
Here’s the thing about a 54% median increase — it doesn’t mean home values jumped 54%.
February only had 15 sales. That’s a tiny sample. And the mix skewed heavily toward higher-end properties. Four of those 15 sales landed in the $700,000 to $800,000 range, and four more sold above $1.2 million. When more than half your closings are $700K and up, the median is going to look inflated.
Compare that to February 2025, when only 14 homes sold at a median of $470,000. Different buyer pool, different mix, different median.
The average sale price only moved 4.8%. That’s closer to the real story.
The Real Story: Nearly 10 Months of Inventory
The number that matters most right now is inventory. Wimberley currently has 149 active listings and 9.93 months of supply.
For context, six months of supply is considered a balanced market. Anything above that favors buyers. At nearly 10 months, Wimberley is firmly in buyer’s market territory.
New listings in February dropped 25.9% from last year (40 new listings), and new contracts fell 33.3% (just 16 went under contract). Fewer listings are coming on, but even fewer buyers are writing offers.
Where the Action Is (and Isn’t)
Not every price range is created equal. This chart tells the real story:
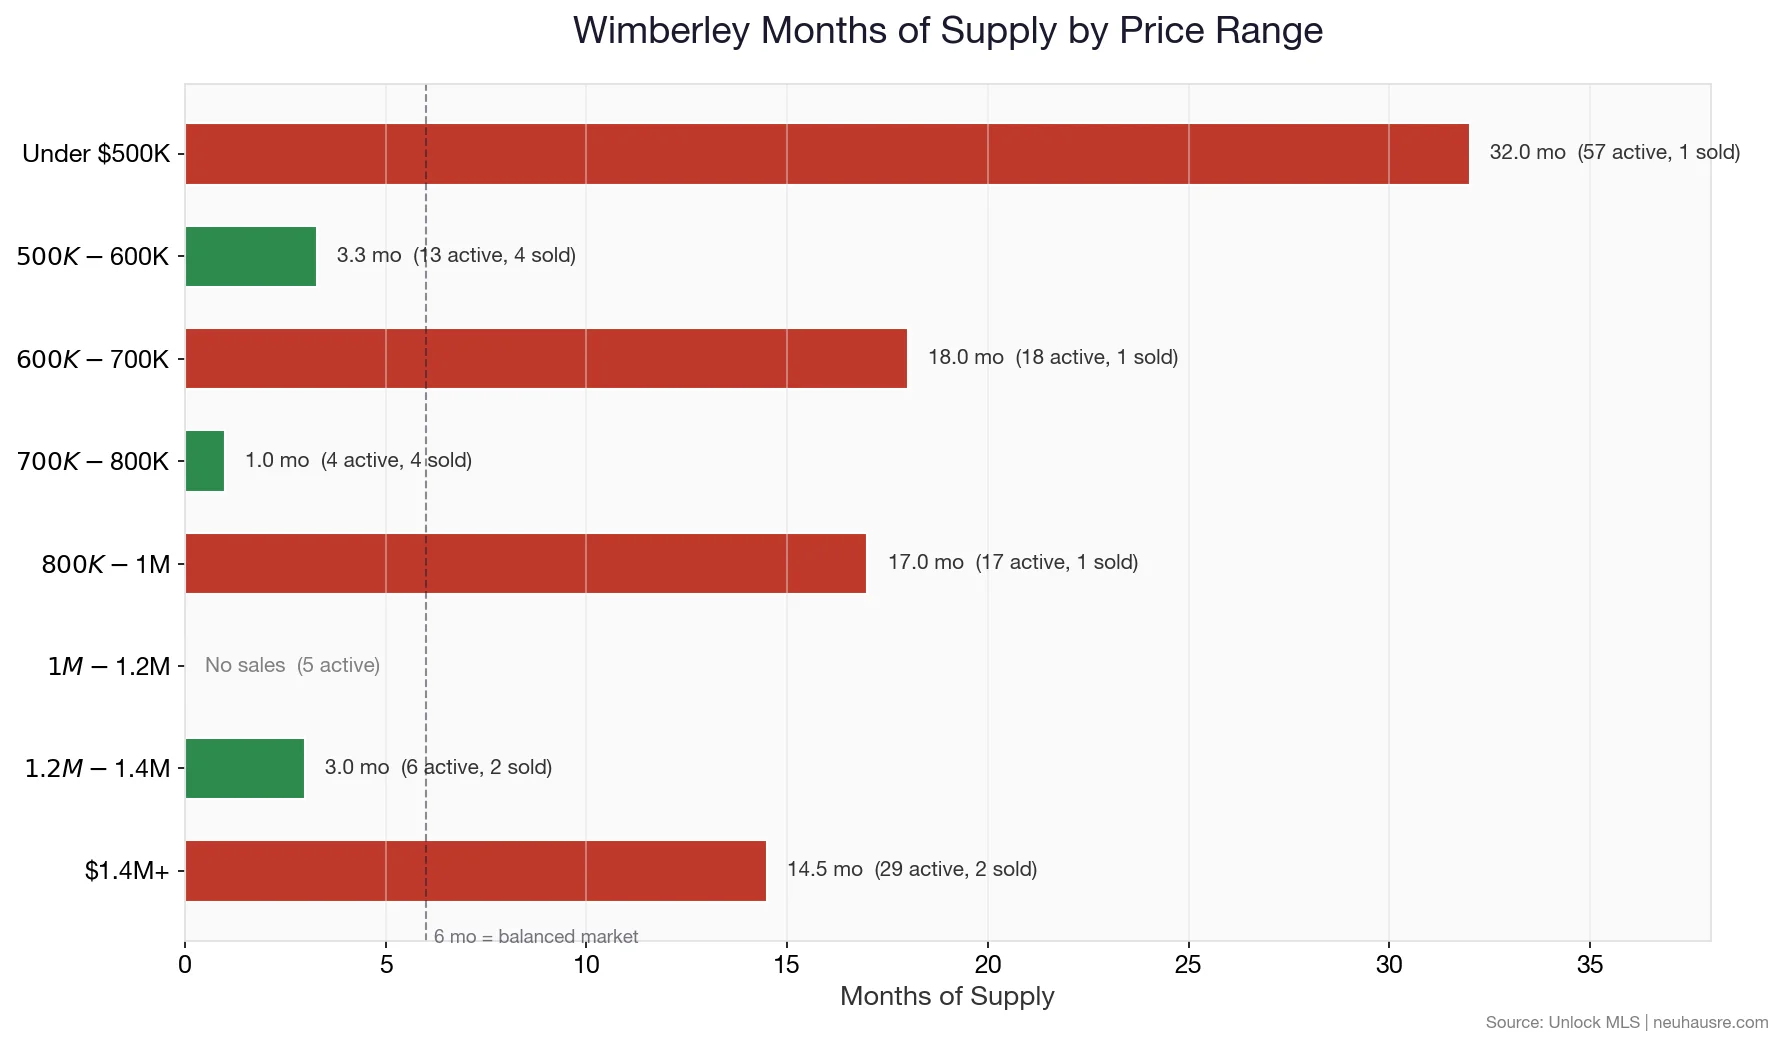
The sweet spots are clear:
$500K to $600K and $700K to $800K are where buyers are competing. Under 4 months of supply in both ranges. If you’re selling in those brackets, you have leverage.
The $1.2M to $1.4M range is also moving well at 3 months of supply.
Everything else? Buyers have time, options, and negotiating power. The under-$500K bracket has 57 listings and just 1 sale last month (32 months of supply). The $600K-$700K and $800K-$1M ranges are similarly stagnant at 17-18 months each.
Homes Are Selling Faster
Despite the high inventory, homes that do sell are moving quicker than last year. Median days on market dropped to 95 days — that’s 79 days faster than February 2025. Average DOM fell to 118, down 54 days year-over-year.
Buyers who find the right home at the right price are acting decisively. The problem for sellers isn’t demand — it’s pricing.
Buyers Are Negotiating Hard
Closed sales in February came in 4.5% below asking price on average. The original list-to-close ratio was 89.5% — meaning sellers are giving up about 10% from their initial asking price by the time a deal closes.
That tells you sellers who price right from the start are getting deals done, while overpriced listings are chasing the market down.
The Bigger Picture: Wimberley Pricing Over Time
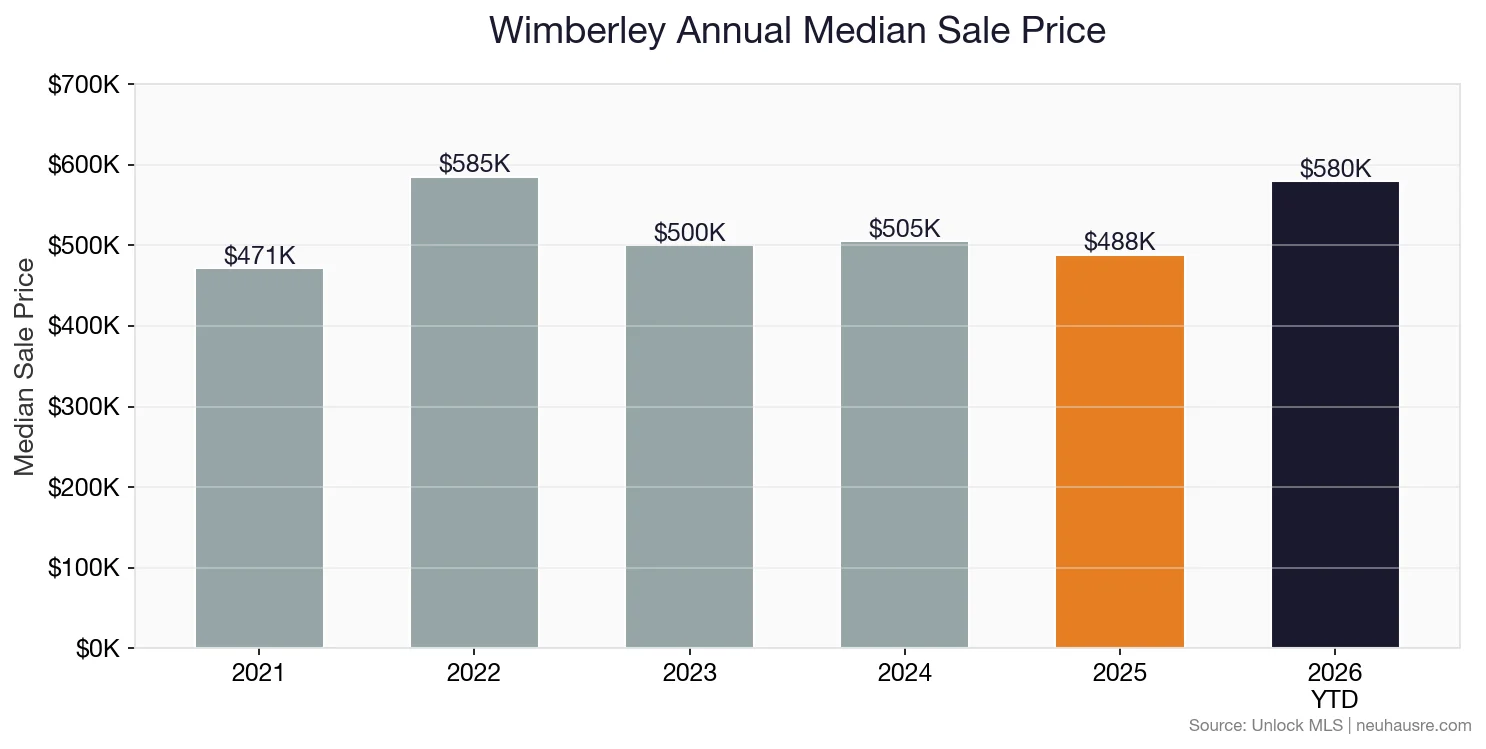
Wimberley prices hit their peak in 2022 at $585K, corrected through 2023-2025, and are showing signs of recovery in early 2026. But with only two months of data, it’s too early to call it a trend.
The monthly view shows where 2026 sits relative to the last two years:
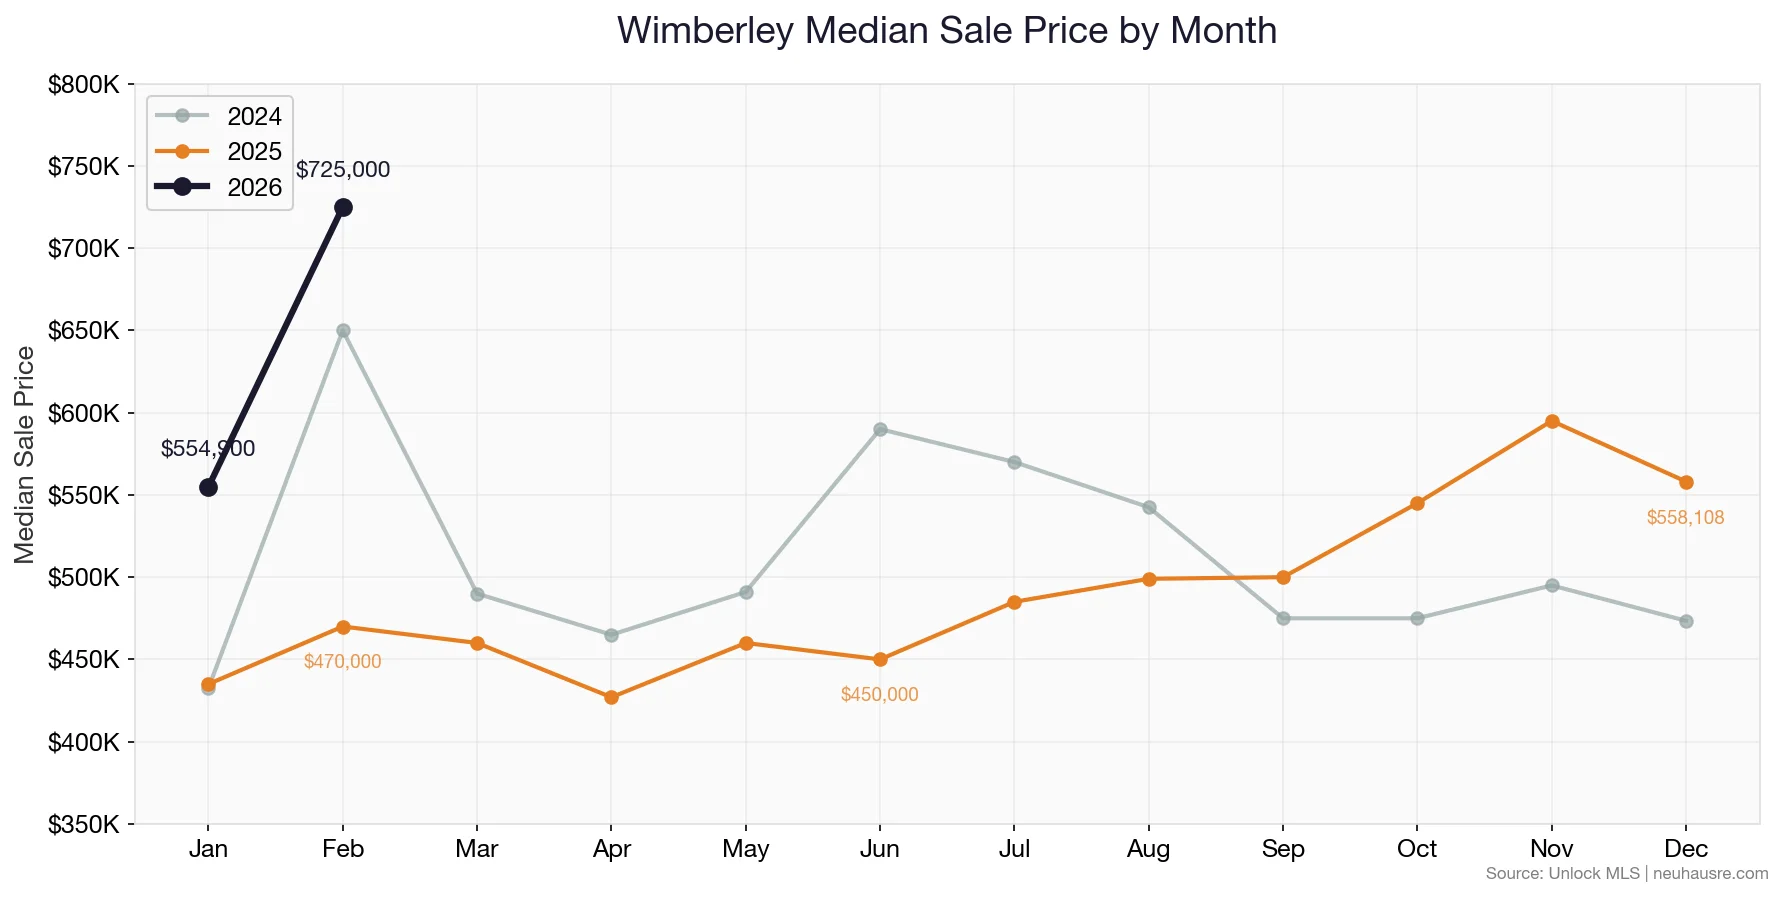
January 2026 started at $554,900 and February jumped to $725,000 — well above the 2024 and 2025 trendlines. Keep in mind these are small monthly samples that can swing with just a few high-end closings.
Frequently Asked Questions
What This Means for Buyers
You have leverage. Nearly 10 months of inventory means you can take your time, negotiate hard, and expect concessions. Focus on the $500K-$600K and $700K-$800K ranges where competition exists — that’s where the best values are moving fast. In other price ranges, you can negotiate 5-10% below asking with confidence.
What This Means for Sellers
Price it right or watch it sit. With 149 active listings and only 15 sales last month, your competition is fierce. The homes that are selling are priced in the sweet spot and are still closing 4.5% below ask. Get your pricing strategy dialed in before you list — the market will tell you quickly if you’re off.
All data sourced from Unlock MLS, current as of March 11, 2026. Wimberley market data includes residential single-family, townhome, and manufactured home sales.
Thinking about buying or selling in Wimberley? Contact the Neuhaus Realty Group for a personalized market analysis based on the latest data.
See all 15 city reports: Austin Area Market Updates: February 2026 Data


