 Ed
Ed 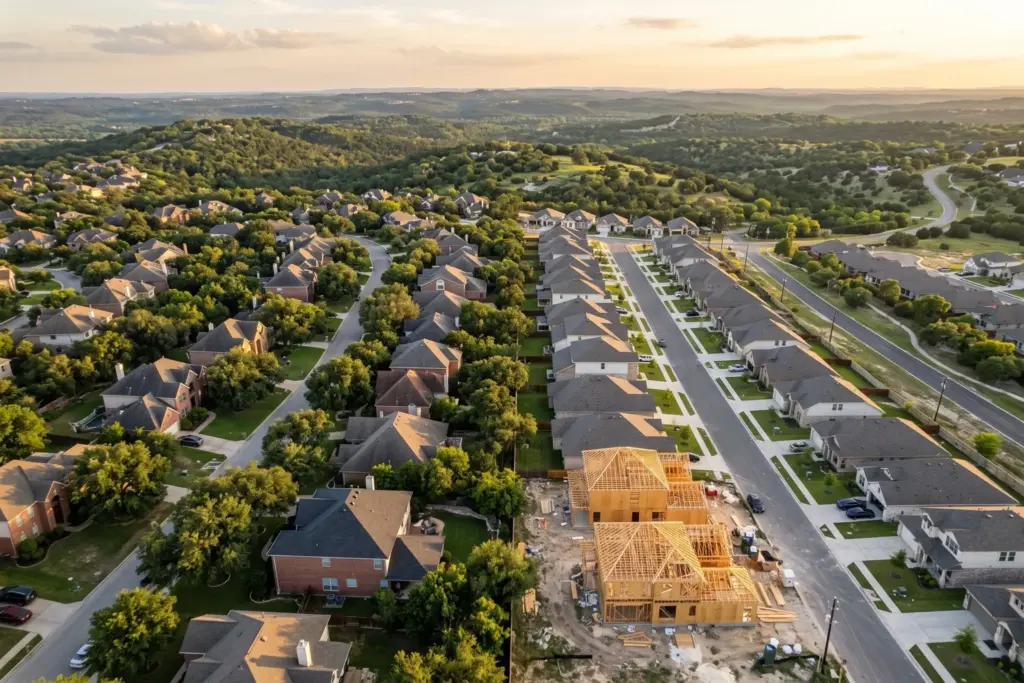
Hays County home prices held up better than Travis County in 2026. The median sale price in Hays for January through August was $364,000, down just 1.4% from the same months of 2025, while Travis County slipped 2.7% to $499,990 and Williamson County slipped 2.9% to $408,000. That’s from every closed residential sale in the Unlock MLS feed that powers our site (houses, condos and townhomes, all of it), so this isn’t a survey, it’s the actual closings.
But here’s the part nobody puts in the headline. Hays is further below its 2022 peak than Travis is. The August 2026 median in Hays was $355,025, which is 27.2% under the April 2022 high of $488,000. Travis was $495,000 in August, 22.7% under its May 2022 high of $640,000. So if you’re asking where are home prices holding up near Austin, the honest answer is “Hays, this year” and “Travis, since the peak” (yes, both are true at the same time, welcome to real estate).
My theory on why goes like this, and it’s a pretty good story right. I think Hays held up because most of the county has been there a long time and there aren’t a whole lot of new homes, while Travis has a lot more homes and a lot more entry-level homes, and the lower price points are having the most trouble right now. I also think a lot of people move out to Hays to retire or live a slower pace of life, so they’re not ready to move anytime soon. And Hays was slower to go up than Travis. I don’t feel like it had the highest highs, and I don’t think it’ll have the lowest lows either. It’s just slower to react.
That’s four claims. So lets do the thing I tell everyone else to do and check them against the data. Some held up. A couple didn’t, and I’m going to say so.
Where are home prices holding up near Austin in 2026?
Here’s the Austin housing market by county, straight from our market data warehouse. Single months bounce around, so I’m showing the 2022 peak month, last August and this August side by side. August 2026 is the latest complete month.
| County | 2022 peak month | Peak median | Aug 2025 | Aug 2026 | Change, 1 year | Change from peak |
|---|---|---|---|---|---|---|
| Travis | May 2022 | $640,000 | $524,990 | $495,000 | -5.7% | -22.7% |
| Williamson | Apr 2022 | $515,000 | $425,000 | $399,900 | -5.9% | -22.3% |
| Hays | Apr 2022 | $488,000 | $362,500 | $355,025 | -2.1% | -27.2% |
| Bastrop | Apr 2022 | $450,942 | $360,950 | $342,990 | -5.0% | -23.9% |
| Caldwell | Jul 2022 | $370,250 | $230,000 | $270,613 | +17.7% | -26.9% |
Source: Neuhaus Realty Group market data, closed residential sales from Unlock MLS, county medians by month. Includes houses, condos and townhomes. September 2026 was still incomplete when we pulled this on October 2, 2026.
The August numbers make Hays look great: down 2.1% in a year while Travis and Williamson each dropped close to 6%. I trust the January through August number more (about 3,070 Hays sales instead of about 400), and it tells the same story with less drama: Hays down 1.4%, Travis down 2.7%, Williamson down 2.9%, Bastrop down 2.9%.
Ok, one thing a median can hide is mix. If fewer cheap houses sell, the median goes up even if no single house got more valuable. So I checked resale price per square foot, which is a lot harder to fool.
| County | Resale median $/sqft, Jan-Aug 2025 | Jan-Aug 2026 | Change | Resale sales under $400K, 2025 | 2026 |
|---|---|---|---|---|---|
| Travis | $284 | $281 | -1.1% | 30.4% | 31.7% |
| Williamson | $209 | $199 | -4.8% | 44.3% | 47.7% |
| Hays | $198 | $202 | +2.0% | 55.1% | 46.3% |
Resale only (new construction removed), January through August, homes from 400 to 10,000 square feet.
Hays resale homes actually gained about 2% per square foot. Travis lost about 1% and Williamson lost about 5%. So the “Hays held up” call survives the mix test. But look at the last two columns, the share of Hays resales under $400K fell from 55.1% to 46.3%. Hold that thought, it matters in a minute.
Claim 4: Hays was slower to go up and slower to come down
I’m starting with the last one because it’s the one I was most sure about (which, if you know anything about Kahneman’s whole thing on confidence, is exactly the one I should have been least sure about).
| County | Jan-Aug 2019 | Jan-Aug 2022 | Jan-Aug 2025 | Jan-Aug 2026 | 2019 to 2022 | 2022 to 2026 | 2025 to 2026 |
|---|---|---|---|---|---|---|---|
| Travis | $360,000 | $590,000 | $514,000 | $499,990 | +63.9% | -15.3% | -2.7% |
| Williamson | $285,000 | $495,000 | $420,000 | $408,000 | +73.7% | -17.6% | -2.9% |
| Hays | $266,900 | $450,000 | $369,019 | $364,000 | +68.6% | -19.1% | -1.4% |
| Bastrop | $233,000 | $411,190 | $350,000 | $339,990 | +76.5% | -17.3% | -2.9% |
| Caldwell | $208,000 | $345,000 | $298,750 | $247,990 | +65.9% | -28.1% | -17.0% |
Median closed price, January through August of each year, so every year compares the same months. Source: Neuhaus Realty Group analysis of Unlock MLS closed sales.
The data disagrees with half of this. Hays did not go up slower. From 2019 to 2022 the Hays median rose 68.6%, more than Travis at 63.9% (Williamson ran even hotter at 73.7%). And Hays has fallen further since, down 19.1% from 2022 versus 15.3% for Travis. In percentage terms Hays had the higher high and, so far, the lower low.
But the “slower to react” part? That one holds. Look at the timing. After the 2023 drop, which hit all three counties about the same (Hays down 11.1%, Travis down 11.9%), Travis basically flattened out: down 1.0% in 2024 and 0.2% in 2025. Hays kept sliding, down 4.5% in 2024 and 3.4% in 2025. This year it flipped. Travis is falling faster and Hays is leveling off. So Hays didn’t avoid the drop, it just took its drop later. That’s slower to react, it’s just not gentler.
Claim 1: Hays doesn’t have a lot of new homes
This is the one the data flat out disagrees with.
| County | Closings, Jan-Aug 2026 | New-construction share 2026 | Share in 2022 | Share in 2019 | Median new home 2026 | Median resale 2026 |
|---|---|---|---|---|---|---|
| Travis | 9,792 | 17.5% | 12.1% | 16.9% | $390,000 | $530,000 |
| Williamson | 7,414 | 36.4% | 23.0% | 25.7% | $408,000 | $408,000 |
| Hays | 3,070 | 47.2% | 26.8% | 28.8% | $334,930 | $430,000 |
| Bastrop | 955 | 44.9% | 27.3% | 18.8% | $335,000 | $350,000 |
| Caldwell | 360 | 56.1% | 24.3% | 5.8% | $226,999 | $300,000 |
New construction = flagged new construction in the MLS, or built in the year of sale or the year before. January through August of each year. Source: Neuhaus Realty Group analysis of Unlock MLS closed sales.
Almost half of everything that closed in Hays this year was new, 47.2%, against 17.5% in Travis. And the Hays share has climbed from 26.8% in 2022. Travis does sell more new homes in raw numbers (1,714 vs 1,449) because Travis is just a much bigger market, so the “Travis has a lot more homes” part of my theory is true. But Hays is not a quiet, built-out county. The county that includes Kyle, Buda, San Marcos, Dripping Springs and Wimberley had 304,390 people in 2025, up 12.9% from 2022, according to Census Bureau estimates published on FRED. That many new people need a lot of new houses.
Here’s where it gets interesting though. The median new home in Hays sold for $334,930 this year. The median resale was $430,000. Builders own the bottom of the Hays market, and that’s probably why the share of resales under $400K dropped so much. A buyer who wants a $340K house can often get a brand new one, so the older $340K house down the street has a tough time. What’s left selling on the resale side is the more expensive stuff, and it’s holding its price per foot. The data points to that as a big part of why Hays “held up,” and it’s not the reason I gave.
Claim 2: the lower price points are having the most trouble
This one the data backs.
| County | Original list price | Sales Apr-Sep 2026 | Sold for % of original list | Change vs Apr-Sep 2025 | Median days on market 2026 | Median days on market 2025 |
|---|---|---|---|---|---|---|
| Travis | Under $400K | 2,432 | 95.5% | -0.5 pts | 41 | 37 |
| Travis | $400K to $600K | 2,035 | 95.7% | +0.8 pts | 34 | 38 |
| Travis | $600K to $1M | 1,956 | 96.3% | +0.9 pts | 27 | 34 |
| Travis | $1M and up | 1,481 | 93.8% | +2.0 pts | 33 | 45 |
| Williamson | Under $400K | 2,493 | 96.0% | -0.1 pts | 38 | 31 |
| Williamson | $400K to $600K | 1,997 | 95.8% | +1.1 pts | 42 | 45 |
| Williamson | $600K to $1M | 1,179 | 93.8% | 0.0 pts | 56 | 50 |
| Williamson | $1M and up | 252 | 92.1% | +0.6 pts | 47 | 48 |
| Hays | Under $400K | 1,192 | 95.2% | +0.2 pts | 43 | 39 |
| Hays | $400K to $600K | 603 | 94.4% | +1.1 pts | 61 | 58 |
| Hays | $600K to $1M | 380 | 95.4% | +0.7 pts | 40 | 50 |
| Hays | $1M and up | 195 | 95.2% | +2.5 pts | 33 | 57 |
April through September closings, grouped by original list price. “Sold for % of original list” is the median of sale price divided by the first list price. Source: Neuhaus Realty Group analysis of Unlock MLS closed sales.
Under $400K is the only price band where days on market went up in all three counties (Travis 37 to 41 days, Williamson 31 to 38, Hays 39 to 43). It’s also the band that lost the most ground on price. Travis under $400K slipped half a point to 95.5% of original list and Williamson slipped a tenth, while every band above it held or improved. In Hays the under-$400K band gained just 0.2 points, the smallest gain of any Hays band.
Now, to be fair to the other end, $1M-plus homes still take the biggest discount in Travis (93.8% of original list). They’re just getting better fast. Days on market for $1M-plus fell in all three counties, from 45 to 33 in Travis and from 57 to 33 in Hays. So the bottom is slowing down and the top is speeding up, that’s not that hard to see right. And it puts real pressure on the sellers we wrote about in why Austin sellers who bought in 2021 to 2023 can’t cut their price, because a slower bottom band means more time sitting at a price they can’t lower.
Claim 3: Hays owners stay put longer
Our data can’t fully test this one, and I want to be straight about why. The people Ed is talking about (ok, the people I’m talking about, I’m not going to refer to myself in the third person) are the ones who don’t sell. A closed-sale database only sees sellers.
What we can measure is how long this year’s sellers owned before they sold, by matching each 2026 resale to the last time that same parcel sold on the MLS.
| County | Resale closings, Jan-Sep 2026 | Prior MLS sale on record | Median years since that sale | Held 10+ years | Held under 5 years |
|---|---|---|---|---|---|
| Travis | 8,892 | 58.2% | 7.3 | 30.5% | 27.7% |
| Williamson | 5,223 | 54.8% | 7.2 | 30.4% | 28.7% |
| Hays | 1,795 | 48.3% | 6.3 | 23.9% | 33.1% |
Resale closings January through September 2026 (new construction removed), matched by parcel and zip to the most recent prior MLS sale. Years are measured only for homes with a prior sale on record. Source: Neuhaus Realty Group analysis of Unlock MLS closed sales.
Among sellers we could match, Hays sellers had owned for less time, not more: a median of 6.3 years versus 7.3 in Travis and 7.2 in Williamson, and only 23.9% had owned 10 years or more versus about 30% in the other two. So the data doesn’t back this one. The caveat is real though. Only 48.3% of Hays resales had a prior MLS sale we could find, against 58.2% in Travis, so a lot of Hays sellers last bought off the MLS or a long time ago, and we can’t see how long they held. I still think the retirees and the slower-pace folks who moved out to the more rural parts of Hays aren’t ready to move anytime soon, and they can ride out a soft fall. I just can’t prove it with this table. That stays my opinion, not a finding.
So what do you do with this?
If you’re buying in Hays under $400K, you’re shopping against builders whether you like it or not. Their median was $334,930 this year, down from $363,265 last year, so compare every resale to the new house a few streets over (and ask what the builder is throwing in, because they’re usually throwing in something). If you’re looking at Travis, the 2026 drop is fresher and the August median of $495,000 is the lowest August median in Travis since 2020, so there’s room to negotiate. Before you fall in love with a payment, run it through what a $495,000 Austin home costs per month at 7.28%.
If you’re selling under $400K in any of these counties, plan on more days on market than last year and price for it from day one. If you’re selling over $1M, this is the best the top end has looked in a year. You can browse what’s active in Hays County or Travis County and set up a saved search so the new listings come to you.
Frequently Asked Questions
Lets talk about your county
I’ve been selling homes around Austin since 2009, and this post is a good reminder to check the gut against the data. My gut went one and a half for four, which for a realtor is honestly not a terrible batting average. If you’re trying to decide between Hays, Travis and Williamson, or you want to know what your house would actually sell for in this market, reach out to me, Ed Neuhaus, and lets grab a coffee and look at your street, not just your county. Be safe, be good, and be nice to people.


