
Austin Averages 228 Sunny Days Per Year, but Those Numbers Hide Some Extreme Swings
Austin recorded a high of 104°F and a low of 18°F in 2025 alone, an 86-degree temperature swing that surprises most newcomers. The National Weather Service station at Camp Mabry logged just 25.94 inches of rain that year, well below the long-term average of 37 inches, while the region also saw an EF-1 tornado, 3-inch hail, and 223 severe thunderstorm warnings across the 15-county metro area.
Those numbers tell a story that generic climate summaries miss. According to the City of Austin’s Office of Climate Action and Resilience, Central Texas sits at the intersection of subtropical humidity, Great Plains storm energy, and Hill Country flash-flood terrain. That combination creates a climate with genuine extremes, and understanding those extremes is essential for anyone buying, selling, or maintaining a home here.
Ed Neuhaus, broker of Neuhaus Realty Group, puts it directly: “Half my buyer consultations with out-of-state relocators involve weather questions. People know Austin is hot, but they rarely understand the full picture, from cedar fever season to foundation-cracking clay soil to flash flood risk. The climate touches every part of homeownership here.”
This guide breaks down Austin’s weather and climate month by month, covers the major hazards, explains the real-world impact on homes and energy bills, and helps you plan your move around the seasons.
Monthly Weather Averages: What Each Season Actually Feels Like
Austin’s climate is classified as humid subtropical (Koppen Cfa), but that textbook label understates the variation. Here is a month-by-month breakdown using 30-year normals from the National Weather Service Austin/San Antonio office, supplemented with 2025 actuals.
| Month | Avg High (°F) | Avg Low (°F) | Avg Rainfall (in) | Avg Humidity (%) | 100°F+ Days (avg) |
|---|---|---|---|---|---|
| January | 62 | 40 | 2.1 | 67 | 0 |
| February | 65 | 43 | 0.9 | 65 | 0 |
| March | 73 | 51 | 2.5 | 66 | 0 |
| April | 80 | 58 | 2.6 | 68 | 0 |
| May | 86 | 66 | 3.8 | 75 | 0 |
| June | 93 | 72 | 3.5 | 70 | 2-4 |
| July | 96 | 74 | 1.9 | 64 | 5-10 |
| August | 97 | 74 | 2.3 | 62 | 8-15 |
| September | 91 | 69 | 3.3 | 66 | 2-5 |
| October | 82 | 59 | 3.9 | 67 | 0 |
| November | 71 | 48 | 2.5 | 68 | 0 |
| December | 63 | 41 | 2.3 | 68 | 0 |
A few things jump out. May and October are the wettest months, not summer. July and August are dry and brutally hot. February is the driest month on average, which also happens to be peak cedar pollen season.
Spring (March Through May)
Spring is Austin’s best season for weather, and most residents will tell you that without hesitation. March brings ideal hiking and outdoor conditions with highs in the low 70s, and the bluebonnet wildflower season peaks in early to mid-April. The Lady Bird Johnson Wildflower Center in Southwest Austin is the premier viewing destination, though 2026 saw a “moderate” display due to a dry fall and warm winter that reduced germination rates.
The tradeoff: spring is also severe weather season. May brings the heaviest average rainfall (3.78 inches) and the risk of severe thunderstorms, large hail, and flash flooding. Temperatures climb rapidly from the 70s in March to the upper 80s by late May.
Summer (June Through September)
There is no sugarcoating it. Austin summers are long and punishing. The heat typically arrives in early June and does not break until mid-to-late September, giving the city roughly four months of sustained temperatures above 90°F.
August is the peak, with average highs of 97°F. In 2011, Austin recorded 90 days at or above 100°F and hit an all-time high of 112°F at Camp Mabry on August 28. That was the worst summer on record, but triple-digit stretches are normal. The 2025 summer produced 22 days at 100°F or above, which was actually considered mild by recent standards (Source). June 2025 recorded zero 100-degree days, a rarity that made local news (Source).
The UV index during Austin summers regularly reaches 11 to 12 (extreme), with unprotected skin burning in as little as 10 minutes during midday. Texas ranks eighth-highest in the nation for UV exposure risk, according to the EPA.
Fall (October Through November)
Fall arrives gradually. October still sees highs in the low 80s, and the first genuinely cool mornings (below 50°F) typically arrive in late October or early November. By mid-November, daytime temperatures settle into the pleasant 60s and 70s. October is also the second-wettest month on average (3.9 inches), and fall thunderstorms can be intense.
For homebuyers, fall is a strategic window. The weather is comfortable for touring properties, and the real estate market enters its second-wave season with less competition than spring. Off-season pricing can work in a buyer’s favor.
Winter (December Through February)
Austin winters are mild compared to most of the country. Average highs stay in the 60s from December through February, and freezing temperatures are relatively rare, occurring on roughly 15 to 25 nights per year. Snow is extremely unusual. When it does happen, as during the February 2021 freeze, the city essentially shuts down.
The flip side of mild winters: cedar fever season runs from December through February, and it affects roughly 10% to 30% of Austin residents.
Summer Heat: What 100-Degree Days Actually Mean for Homeowners
The summer heat is not just uncomfortable. It has direct financial and structural consequences for Austin homeowners.
Energy Costs
Austin Energy, the city-owned utility, serves roughly 550,000 customers. During peak summer months, residential electricity bills commonly run $200 to $400 or more depending on home size, insulation quality, and thermostat settings. The average rate is approximately 12 cents per kilowatt-hour, but tiered pricing means heavy users pay more per unit.
Air conditioning accounts for 50% to 70% of summer electricity consumption in Austin homes. A 2,500-square-foot home with an older HVAC system can easily consume 2,000 to 3,000 kWh per month in July and August. Homes with solar panel systems can offset a significant portion of this cost, though Austin Energy’s Value of Solar rate (9.91 cents per kWh) reduced the financial return compared to traditional net metering.
HVAC Stress and Lifespan
HVAC systems in Austin work harder and wear out faster than in most markets. The average lifespan of a central AC unit nationally is 15 to 20 years. In Central Texas, 10 to 15 years is more realistic due to the extended cooling season, which runs from April through October, roughly seven months of sustained use.
A new HVAC system for a typical Austin home costs $6,000 to $15,000 installed, depending on efficiency rating and capacity. During a home maintenance inspection, buyers should pay close attention to the age and condition of the HVAC system, as replacement is one of the largest single expenses a homeowner faces.
Foundation Impact
Austin sits on expansive clay soils that shrink during dry periods and swell when wet. Summer drought conditions cause the soil to pull away from foundations, creating gaps that allow movement. This seasonal cycle of expansion and contraction is the primary cause of foundation problems in Texas. Foundation repair costs range from $5,000 to $30,000 or more, and most homeowners insurance policies do not cover foundation damage.
Watering your foundation during drought months is standard practice in Central Texas. Running a soaker hose 6 to 12 inches from the foundation for 30 to 60 minutes every few days during dry spells helps maintain consistent soil moisture and reduces the risk of differential settlement.
Winter Weather and Freeze Events: What Uri Changed
Austin’s winters are mild most of the time. But the rare freeze events that do occur have outsized consequences, because the city’s infrastructure was historically designed for heat, not cold.
The Winter Storm Uri Benchmark
In February 2021, Winter Storm Uri dropped temperatures to single digits across Central Texas for multiple consecutive days. The results were catastrophic. More than 4.5 million Texas homes lost power, some for four days or longer. Approximately 250 people died statewide. The economic toll reached an estimated $80 billion to $130 billion, according to the Texas Comptroller.
The Electric Reliability Council of Texas (ERCOT), which manages the state’s independent power grid, ordered 20,000 MW of rolling blackouts, the largest manually controlled load shedding event in U.S. history. Natural gas supply failures, frozen wind turbines, and unweatherized power plants all contributed to the collapse.
What Has Changed Since Uri
The Texas Legislature responded with Senate Bills 2 and 3, which mandated weatherization of power generation facilities, natural gas infrastructure, and transmission equipment. Since 2021, ERCOT has completed weatherization inspections on more than 3,300 power plants and transmission facilities.
The grid has also grown substantially. Battery storage, which was essentially nonexistent in 2021, now exceeds 17,000 MW of capacity. Batteries can inject power in milliseconds and bridge gaps while thermal generators ramp up. In total, 90% of new generation added to the ERCOT grid since 2021 has been solar, wind, and battery storage.
During a January 2026 winter storm, the grid performed well. Energy supply comfortably exceeded demand, aided by the more diverse generation mix. However, an analysis by ERCOT’s own planning division found that a true Uri-repeat scenario (85.3 GW of demand) would still leave Texas approximately 14.9 GW short of available resources (70.4 GW), meaning the grid is better but not immune to extreme cold.
What Homeowners Should Do
- Insulate pipes. Exposed pipes in attics, garages, and crawl spaces are the most common source of burst-pipe damage during freezes. Foam insulation sleeves cost $2 to $5 per 6-foot section.
- Know your shutoff valve. If pipes burst, shutting off water at the main valve prevents catastrophic flooding. Locate it before you need it.
- Weatherize the home. Austin Energy offers up to $1,800 in rebates for insulation and duct sealing. The federal 25C tax credit (available through 2032) covers 30% of the cost of qualifying efficiency upgrades up to $1,200 per year. Most Austin homes lose 20% to 30% of conditioned air through leaky ductwork.
- Consider a backup heat source. Homes with gas fireplaces or wood-burning fireplaces have an advantage during power outages. Portable propane heaters (used with proper ventilation) are another option.
- Generator or battery backup. A whole-house standby generator ($8,000 to $25,000 installed) provides full coverage. A Tesla Powerwall or similar battery system ($10,000 to $15,000) can keep essential circuits running for hours. Portable generators ($500 to $2,000) are a more affordable option.
Severe Weather: Hail, Flash Floods, and Tornado Risk
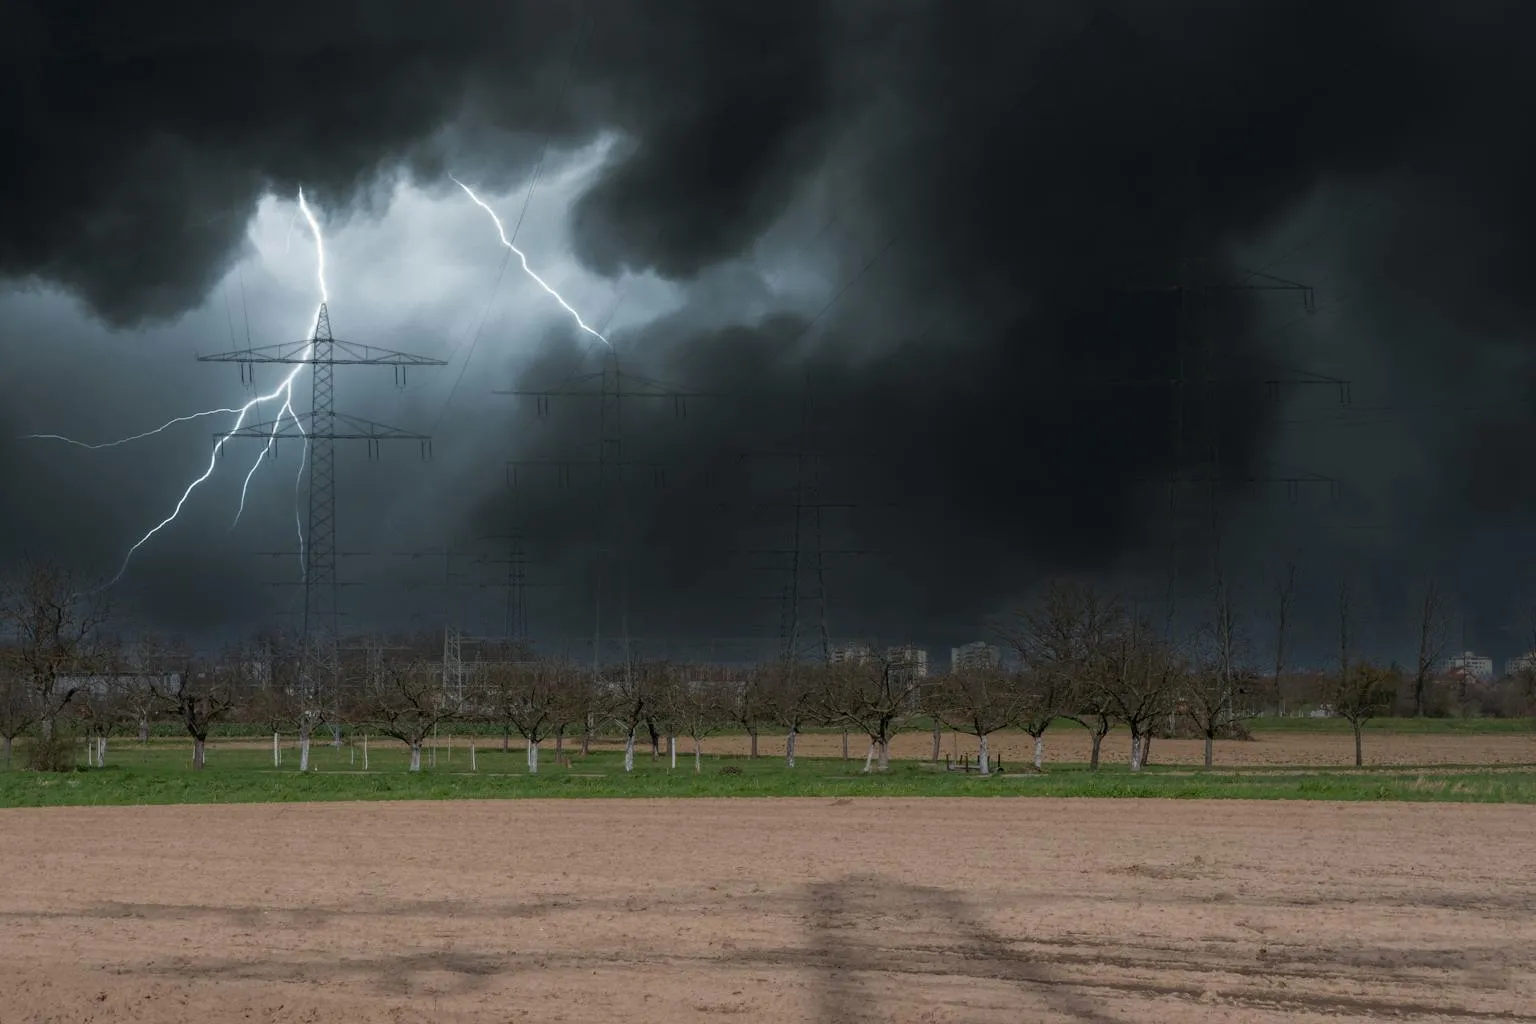
Central Texas sits in a convergence zone where Gulf moisture, dry air from the west, and frontal boundaries from the north collide. The result is a severe weather season that runs primarily from March through June, with a secondary peak in October and November.
Flash Flooding: Austin’s Number One Weather Hazard
Austin sits in the heart of what meteorologists call Flash Flood Alley, the most flash-flood-prone region in North America. The combination of steep Hill Country terrain, shallow limestone bedrock that sheds water rather than absorbing it, and intense Gulf moisture creates conditions where calm creeks can become raging torrents in under 30 minutes.
The worst flood corridors in the Austin metro include:
- Onion Creek (78745, 78748): The most flood-damaged area in Austin. Repeated catastrophic flooding led the City of Austin to purchase and demolish over 700 homes in a multi-hundred-million-dollar buyout program through FEMA’s Hazard Mitigation Grant Program.
- Shoal Creek (downtown/central): The 1981 Memorial Day flood killed 13 people along this corridor. It remains a significant flood risk through downtown.
- Williamson Creek (South Austin): Multiple flooding events have prompted bridge upgrades and buyouts in the 78745 zip code.
- Bull Creek (Northwest Austin): Spicewood Springs Road closes regularly during heavy rain events.
For homebuyers, flood zone designation is not optional knowledge. FEMA flood zones directly affect mortgage requirements, insurance costs, and property values. Properties in Zone A or AE require flood insurance for federally backed mortgages, and premiums can add $1,000 to $4,000 or more per year. Flood zone designation can reduce property value by 5% to 15%.
The City of Austin provides a free, interactive flood risk tool at maps.austintexas.gov/floodpro/, and Austin’s Watershed Protection Department expects updated flood models by mid-2026 that could reclassify some properties.
Hailstorms
Hail is Central Texas’s most expensive weather hazard on an annual basis. Austin averages 3 to 5 significant hail events per year, primarily from March through May. In 2025, a May storm dropped 3-inch hail on Leander in northern Williamson County.
Hail damage to roofing is the most common homeowners insurance claim in Austin. Impact-resistant roofing (Class 4 rated) can reduce insurance premiums and is increasingly popular in new construction. A standard composition shingle roof replacement in Austin costs $8,000 to $15,000, while impact-resistant materials add 20% to 30% to the cost but can last significantly longer.
Tornado Risk
Tornadoes are uncommon in Austin but not impossible. The metro area sits on the southern edge of Tornado Alley, and EF-0 to EF-1 tornadoes touch down occasionally. In May 2025, an EF-1 tornado hit near Oakalla in Burnet County with estimated winds of 110 mph, tracking 3.1 miles.
Stronger tornadoes (EF-2 or above) are rare in the immediate Austin area. The primary risk is from short-lived supercell tornadoes during spring severe weather outbreaks. Safe rooms and tornado shelters are not standard in Austin construction but are available as aftermarket installations for $3,000 to $10,000.
Cedar Fever Season: Austin’s Unique Winter Allergy
If you move to Austin and have never experienced cedar fever, prepare yourself. Mountain cedar (Juniperus ashei) is the dominant allergen in Central Texas during winter, and the pollen season runs from approximately December through February, with peak intensity in January and early February.
There are approximately seven Ashe juniper trees for every person in Texas, and a single tree can release billions of pollen grains. During heavy release events, the pollen is visible as a yellow-green cloud drifting through the Hill Country. In 2026, sensors atop the KXAN studios in downtown Austin recorded a peak count of 8,135 pollen particles per cubic meter on February 7, the highest reading of the season.
Symptoms and Impact
Cedar fever symptoms mimic a cold or flu: intense sneezing, nasal congestion, itchy and watery eyes, sore throat, fatigue, and headaches. Despite the name, actual fever is possible but uncommon. For severe sufferers, cedar season can mean weeks of reduced productivity, disrupted sleep, and general misery.
Roughly 10% to 30% of Austin-area residents experience cedar allergy symptoms, according to the Greater Austin Allergy clinic. People who have never had allergies often develop cedar sensitivity after 2 to 5 years of living in the area.
Management Strategies
- Medications: Over-the-counter antihistamines (cetirizine, loratadine, fexofenadine), nasal corticosteroid sprays (fluticasone, mometasone), and antihistamine nasal sprays (azelastine) are first-line treatments. Starting medications 2 weeks before the season begins improves effectiveness.
- Immunotherapy: Allergy shots or sublingual drops can reduce sensitivity over time. Treatment takes 3 to 5 years but provides lasting relief for many patients.
- Home strategies: Keep windows closed during peak pollen days. Run HVAC with MERV 11 or higher filters. Shower and change clothes after outdoor activities. Consider a standalone HEPA air purifier for bedrooms.
- Monitoring: Check daily pollen counts at austinpollen.com or through the KXAN weather app. Avoid outdoor exercise on high-count days.
Real Estate Implications
Cedar density varies dramatically by location. Neighborhoods closer to the Hill Country (west and southwest Austin, Bee Cave, Lakeway, Dripping Springs) have heavier cedar exposure than neighborhoods on the eastern prairie side of town. Some allergy-conscious buyers specifically target East Austin, Pflugerville, or Round Rock for this reason.
The ERCOT Power Grid: What Homeowners Need to Know
Texas operates its own independent power grid through ERCOT, which manages about 90% of the state’s electric load. Unlike most states, Texas is not interconnected with the Eastern or Western grids, which means it cannot import large amounts of electricity during emergencies.
Current Grid Status (2026)
Since Winter Storm Uri, the grid has undergone significant expansion and reform:
| Metric | 2021 (Pre-Uri) | 2026 |
|---|---|---|
| Battery storage capacity | ~500 MW | 17,000+ MW |
| Weatherization inspections | None mandatory | 3,300+ facilities inspected |
| New generation mix | Primarily gas/wind | 90% solar/wind/battery since 2021 |
| Large-load interconnection requests | N/A | 205 GW (up from 56 GW in Sep 2024) |
The surge in interconnection requests is driven primarily by AI data centers, cryptocurrency mining, and industrial expansion. Senate Bill 6, passed in 2025, specifically addresses electricity planning and infrastructure costs for large energy consumers. The question for residents is whether grid capacity growth can keep pace with the demand surge from these new loads.
What This Means for Homeowners
- Summer conservation alerts: ERCOT issues conservation appeals during extreme heat when demand approaches supply limits. These are voluntary but increasingly frequent.
- Time-of-use pricing: Austin Energy is exploring time-of-use rates that would charge more for electricity during peak afternoon hours. Homeowners with solar and battery storage would benefit most.
- Backup power planning: The grid is more resilient than in 2021 but still vulnerable to extreme events. A whole-house generator or battery system is the most reliable insurance.
Flood Zones and Flood Insurance: A Buyer’s Guide
Austin’s flood risk is not a peripheral concern. Flooding is the number one natural hazard in the city, and the financial implications for homeowners are significant.
Understanding FEMA Flood Zones
| Zone | Risk Level | Insurance Required? | Annual Premium Range |
|---|---|---|---|
| Zone X (unshaded) | Minimal | No | N/A (but recommended) |
| Zone X (shaded) | Moderate (500-yr) | No | $300-$800 if purchased |
| Zone A | High (100-yr) | Yes (federal mortgage) | $1,000-$3,000 |
| Zone AE | High (100-yr, detailed) | Yes (federal mortgage) | $1,500-$4,000+ |
The National Flood Insurance Program (NFIP) provides coverage up to $250,000 for the structure and $100,000 for contents. Private flood insurance options can provide higher limits, sometimes at competitive rates. FEMA’s Risk Rating 2.0 methodology, which took effect in 2021, prices policies based on individual property characteristics rather than simple zone placement, meaning two homes in the same zone can have very different premiums.
How to Check Your Flood Risk
- City of Austin FloodPro: maps.austintexas.gov/floodpro/ provides detailed flood risk data including regulatory floodplain, erosion hazard zones, and critical water quality zones
- FEMA Flood Map Service Center: msc.fema.gov for official FIRM (Flood Insurance Rate Map) panels
- Seller disclosure: Texas sellers must disclose known flooding history on the Seller’s Disclosure Notice
- Title company: Flood zone determination is a standard part of the title search process
For a deeper analysis of flood zone buying considerations, see our Complete Guide to Austin Flood Zones for Homebuyers.
Drought, Water Supply, and Watering Restrictions
Austin’s water supply comes from the Colorado River system, primarily through Lakes Travis and Buchanan (collectively called the Highland Lakes). The Lower Colorado River Authority (LCRA) manages water allocation, and supply levels directly determine watering restrictions for Austin Water customers.
Water Restriction Stages
| Stage | Trigger | Restrictions |
|---|---|---|
| Conservation | Default / normal conditions | Automatic irrigation: 1 day/week. Hose-end: 2 days/week |
| Stage 1 | Highland Lakes ≤1.4M acre-feet | Automatic irrigation: 1 day/week. Hose-end: 1 day/week |
| Stage 2 | Highland Lakes ≤900K acre-feet | Automatic irrigation: 1 day every 2 weeks. Hose-end: 1 day/week |
| Stage 3 | Highland Lakes ≤600K acre-feet | No automatic irrigation. Hose-end: 1 day/week for trees/foundations |
| Stage 4 | Emergency conditions | No outdoor watering |
As of September 2, 2025, Austin moved from Stage 2 (in effect since August 2023) back to the Conservation stage after extensive rains in July 2025 filled Lakes Buchanan and Travis to more than 1.9 million acre-feet (94% capacity). As of April 16, 2026, Lake Travis held 815,835 acre-feet, and the LCRA submitted an updated Water Management Plan to TCEQ in March 2026 with more conservative triggers.
Impact on Homeowners
Water restrictions directly affect lawn and landscape maintenance. Austin’s native and adapted landscaping (xeriscaping) has become increasingly popular, both for environmental reasons and for practical water-cost management. An Austin Water residential bill for a typical household runs $50 to $120 per month depending on usage and lot size.
Foundation watering during drought is permitted even under Stage 3 restrictions, because foundation damage from soil shrinkage is a significant and costly structural risk. Soaker hoses placed 6 to 12 inches from the foundation perimeter are the recommended method.
Wildflower Season and the Best Months to Be Outside
Central Texas wildflower season typically runs from late March through mid-May, with bluebonnets (the state flower) peaking in early to mid-April. The display varies year to year depending on fall and winter rainfall, soil temperature, and freeze timing.
In 2026, Texas wildflower experts predicted a “moderate” bluebonnet season due to a dry fall and warm winter that reduced germination rates. Even in moderate years, though, the Hill Country west of Austin produces impressive displays along Highway 290, Highway 71, and the backcountry roads around Willow City Loop near Fredericksburg.
The Best Weather Months in Austin
| Activity | Best Months | Why |
|---|---|---|
| House hunting / touring homes | October, November, March, April | Comfortable temps for walking properties, manageable inventory |
| Moving day | October, November, March | Mild weather, movers available (less demand than summer) |
| Outdoor recreation | March, April, October, November | Ideal temps for hiking, biking, and water activities |
| Landscaping / yard work | March, April, October | Growing season without extreme heat |
| Pool season | May through September | Water temps above 80°F, pool ownership makes financial sense |
| Wildflower viewing | Late March through mid-April | Bluebonnet peak (weather dependent) |
Best Months to Move to Austin
From a weather perspective, October and November are the sweet spot. Temperatures are comfortable (highs in the 70s to low 80s), severe weather risk is lower than spring, and moving companies have more availability than the summer rush. Spring (March through May) is the other strong window, though you will compete with more buyers in the real estate market.
Summer moves (June through August) are physically brutal. Movers will not want to carry furniture up stairs at 2 PM in August, and neither will you. If a summer move is unavoidable, schedule the truck for a 7 AM start and plan to finish by early afternoon.
For a complete relocation timeline and checklist, see our Complete Guide to Moving to Austin.
UV Exposure and Sun Safety
Austin’s latitude (30.27°N) and clear-sky frequency create UV conditions that catch newcomers off guard, especially those arriving from northern cities.
UV Index by Season
| Season | Typical UV Index (Midday) | Burn Time (Fair Skin) | Precautions |
|---|---|---|---|
| Winter (Dec-Feb) | 4-6 (Moderate to High) | 25-30 min | Sunscreen on extended outdoor time |
| Spring (Mar-May) | 8-11 (Very High to Extreme) | 10-15 min | Sunscreen, hat, shade during midday |
| Summer (Jun-Aug) | 10-12 (Very High to Extreme) | Under 10 min | Limit midday exposure, SPF 30+, UV clothing |
| Fall (Sep-Nov) | 5-9 (Moderate to Very High) | 15-25 min | Sunscreen, especially early fall |
Texas ranks eighth-highest nationally for UV exposure risk, according to EPA data. Skin cancer rates in the state are 5% above the national average. For homeowners, UV exposure also accelerates wear on exterior paint, roofing materials, decking, and patio furniture. South-facing and west-facing walls and windows take the most UV damage.
Window tinting (or low-E glass in newer construction) reduces UV penetration and lowers cooling costs. A professional residential window tint application costs $5 to $15 per square foot in Austin.
Home Weatherization: Preparing for Both Extremes
Austin homes need to handle 100°F summers and occasional sub-freezing winters. That dual requirement makes weatherization more complex than in single-extreme climates.
Insulation and Air Sealing
Most Austin homes, particularly those built before 2000, are under-insulated by modern standards. Attic insulation should be R-38 to R-60 (13 to 20 inches of blown cellulose or fiberglass). Upgrading attic insulation costs $1.50 to $4.50 per square foot, with typical projects for 1,800-square-foot attics running $3,000 to $6,000.
Austin Energy offers a rebate of up to $1.31 per square foot for insulation upgrades, and up to $1,800 total for combined insulation and duct sealing projects. The Weatherization Assistance Program provides free weatherization improvements for qualifying customers at or below 200% of the federal poverty level (approximately $62,400 for a family of four in 2026).
Duct sealing delivers the fastest payback of any weatherization upgrade. Most Austin homes lose 20% to 30% of conditioned air through leaky ductwork, meaning you are paying to cool or heat air that never reaches the living space. Professional duct sealing costs $300 to $700 and often pays for itself within two years.
Weatherization Checklist for Austin Homeowners
- Attic insulation: R-38 minimum (R-60 recommended). Check depth annually; insulation compresses over time.
- Duct sealing: Have HVAC contractor pressure-test ductwork and seal leaks. 20-30% air loss is typical in older homes.
- Window and door seals: Replace weatherstripping and caulk around windows and exterior doors every 3 to 5 years.
- Pipe insulation: Insulate exposed pipes in attics, garages, and exterior walls. Critical for freeze protection.
- HVAC tune-up: Professional maintenance twice per year (spring for cooling, fall for heating). Cost: $80 to $150 per visit.
- Water heater: Insulate the tank (if tank-style) and set temperature to 120°F. Consider a tankless upgrade for efficiency.
- Radiant barrier: In Austin’s climate, a radiant barrier in the attic can reduce cooling costs by 5% to 10%. Cost: $500 to $1,500.
Austin’s Climate and the Real Estate Market
Climate affects Austin real estate in ways that go beyond comfort. Here is how weather patterns directly impact buying, selling, and homeownership decisions.
Seasonal Market Patterns
The Austin real estate market follows a predictable seasonal rhythm shaped partly by weather:
- Spring (March through May): Highest buyer activity, highest inventory, strongest prices. Comfortable weather for touring drives more showings.
- Summer (June through August): Activity drops as heat discourages casual lookers. Serious buyers remain, and sellers may accept lower offers. Mid-April is statistically the best window for sellers to list, according to CultureMap Austin.
- Fall (September through November): A second wave of motivated buyers enters the market. Weather is comfortable. Less competition than spring.
- Winter (December through February): Lowest inventory and activity. Cedar fever season adds friction. Motivated sellers may offer better terms.
Climate-Driven Costs Buyers Should Budget For
| Item | Annual Cost Range | Notes |
|---|---|---|
| Electricity (HVAC-heavy) | $2,400-$4,800 | Higher for older homes, lower with solar |
| Flood insurance (if required) | $1,000-$4,000+ | Zone A/AE properties with federal mortgage |
| Hail damage deductible | $2,000-$10,000 | Many TX policies have 1-2% wind/hail deductible |
| Foundation maintenance | $200-$600 | Soaker hoses, tree root management, drainage |
| HVAC maintenance | $200-$400 | Semi-annual tune-ups, filter replacement |
| Lawn/landscape (water) | $600-$1,800 | Irrigation, drought-tolerant plants reduce cost |
| Pest control | $300-$600 | Quarterly service for termites, fire ants, etc. |
Insurance Implications
Austin’s weather drives homeowners insurance costs significantly higher than national averages. Texas homeowners pay an average of $3,500 to $5,000 per year, compared to the national average of approximately $2,300. The primary drivers are hail, wind, and water damage risk.
Key insurance considerations in Austin’s climate:
- Wind/hail deductible: Most Texas policies carry a separate wind/hail deductible of 1% to 2% of the home’s insured value. On a $500,000 home, that is $5,000 to $10,000 out of pocket before insurance pays.
- Flood insurance: Standard homeowners policies do not cover flooding. Even homes outside FEMA flood zones can flood. Consider purchasing a flood policy regardless of zone designation.
- Impact-resistant roofing discount: Class 4 impact-resistant shingles can earn premium discounts of 10% to 35% depending on the carrier.
Climate Projections: What the Next Decade Looks Like
The City of Austin’s Office of Climate Action and Resilience publishes climate projections based on downscaled global climate models. The outlook for the Austin metro through the 2030s includes:
- More extreme heat days: The number of days above 100°F is projected to increase from a current average of 15 to 25 per year to 30 to 45 per year by the 2030s under moderate emissions scenarios.
- Longer droughts, more intense rainfall: The “whiplash” pattern of drought followed by intense rainfall events is expected to intensify. Total annual precipitation may remain similar, but it will arrive in fewer, heavier bursts.
- Rising cooling demand: The cooling season is projected to extend by 2 to 4 weeks by mid-century, increasing HVAC costs and accelerating equipment wear.
- Water supply pressure: Population growth combined with drought variability will continue to strain the Highland Lakes system. The LCRA’s Water Management Plan update (submitted March 2026) includes more conservative triggers as a result.
For real estate, these projections reinforce the importance of home efficiency, flood zone awareness, and infrastructure resilience when making buying decisions. Homes with modern insulation, efficient HVAC systems, and thoughtful landscaping will perform better and cost less over time.
Frequently Asked Questions
Planning Your Move Around Austin’s Climate
Austin’s weather rewards those who understand it. The summers are genuinely intense, but the other nine months offer some of the best outdoor living conditions in the country. Spring wildflowers, fall sunset walks along Lady Bird Lake, and mild winters that rarely require a heavy coat make the climate a net positive for most residents.
For homebuyers, the key takeaway is this: Austin’s climate is a factor in nearly every homeownership decision, from the HVAC system you inherit to the flood zone your property sits in to the insurance premiums you will pay. Understanding the seasonal patterns, the hazards, and the costs puts you in a stronger position to make smart decisions.
Neuhaus Realty Group works with buyers and sellers across Lakeway, Bee Cave, Dripping Springs, and the greater Austin metro. If you are relocating to Central Texas and want local expertise on how weather and climate affect specific neighborhoods and properties, reach out for a consultation.


